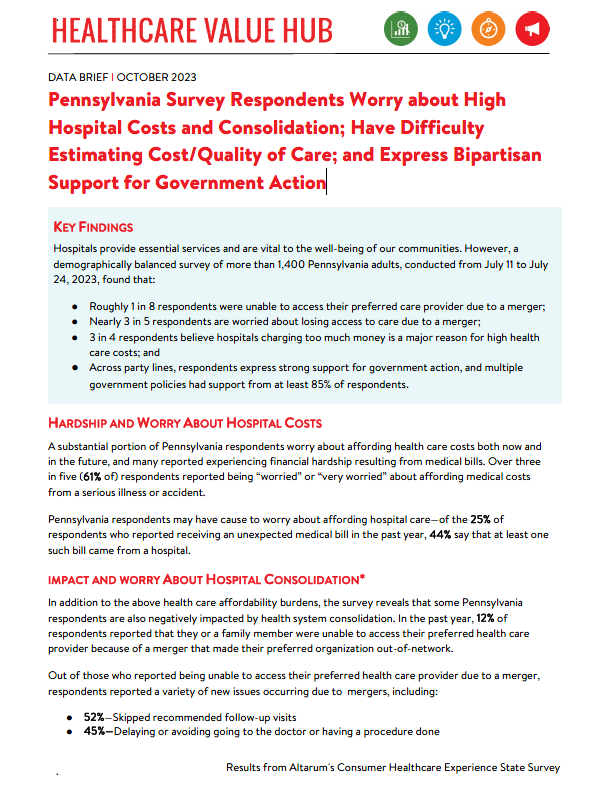
Pennsylvania Survey Respondents Worry about High Hospital Costs and Consolidation; Have Difficulty Estimating Cost/Quality of Care; and Express Bipartisan Support for Government Action
Key Findings
Hospitals provide essential services and are vital to the well-being of our communities. However, a
demographically balanced survey of more than 1,400 Pennsylvania adults, conducted from July 11 to July
24, 2023, found that:
- Roughly 1 in 8 respondents were unable to access their preferred care provider due to a merger;
- Nearly 3 in 5 respondents are worried about losing access to care due to a merger;
- 3 in 4 respondents believe hospitals charging too much money is a major reason for high health care costs; and
- Across party lines, respondents express strong support for government action, and multiple government policies had support from at least 85% of respondents.
Hardship and Worry about Hospital Costs
A substantial portion of Pennsylvania respondents worry about affording health care costs both now and
in the future, and many reported experiencing financial hardship resulting from medical bills. Over three
in five (61% of) respondents reported being “worried” or “very worried” about affording medical costs
from a serious illness or accident.
Pennsylvania respondents may have cause to worry about affording hospital care—of the 25% of
respondents who reported receiving an unexpected medical bill in the past year, 44% say that at least one
such bill came from a hospital.
Impact and Worry About Hospital Consolidation*
In addition to the above health care affordability burdens, the survey reveals that some Pennsylvania
respondents are also negatively impacted by health system consolidation. In the past year, 32% of all
respondents were aware of a merger or acquisition in their community, and 12% of those respondents
reported that they or a family member were unable to access their preferred health care provider
because of a merger that made their preferred organization out-of-network.
Out of those who reported being unable to access their preferred health care provider due to a merger,
respondents reported a variety of new issues occurring due to mergers, including:
- 52%—Skipped recommended follow-up visits
- 45%—Delaying or avoiding going to the doctor or having a procedure done
- 38%—Changed your preferred doctor or hospital
- 24%—Skipped filling a prescription medication
- 20%—Changed health plan coverage to include your preferred doctor or hospital
- 11%—Stayed with preferred health care provider and now pay out-of-network/out-of-pocket costs
- 6%—Switched to telehealth options to continue seeing your preferred doctor
Out of those who reported that the merger caused some other type of burden for them or their families,
when asked about the greatest burden hospital mergers had created for respondents and their families,
respondents reported it created the following challenges:
- 34%—Added wait time when searching for a new provider who is accepting new patients;
- 23%—Added financial burden;
- 15%—Created a hard time finding a new provider that I trust or respect; and
- 10%—Added transportation burden.
While the share of respondents unable to access their preferred health care organization because of a
merger was relatively small, 58% reported that, if mergers or acquisitions were happening in their
community, they would be somewhat, moderately, or very worried. When asked about their largest on
concern, respondents reported:
- 27%—I’m concerned I will have fewer choices of where to receive care
- 27%—I’m concerned my doctor may no longer be covered by my insurance
- 20%—I’m concerned I will have to pay more to see my doctor
- 15%—I’m concerned I will have to travel farther to see my doctor
- 12%—I’m concerned I will have a lower quality of care
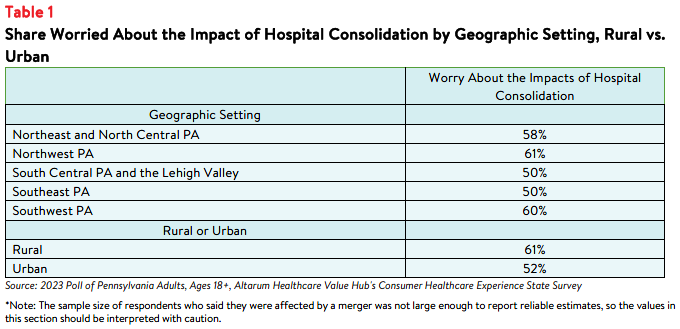
Interestingly, respondents living in rural areas more frequently reported concerns about the impact of
hospital consolidation compared to those living in urban areas (see Table 1). In addition, worry about the
impacts of hospital consolidation were more frequently reported by respondents in Northwest and North
Central PA and Southwest PA compared to other geographic areas.
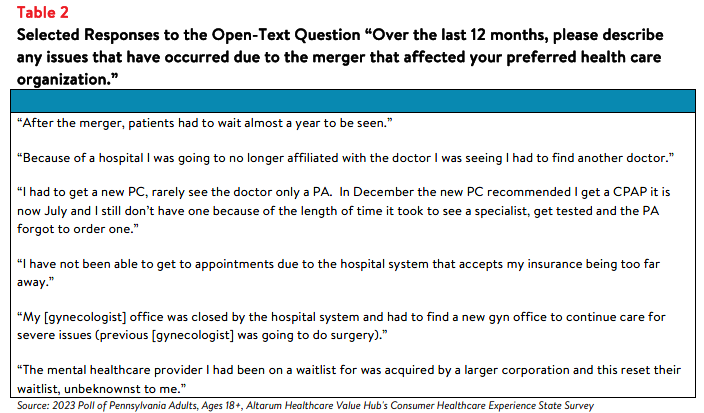
Survey respondents were also asked to share their experiences following hospital consolidation. Selected
responses are listed below in Table 2.
Navigating Hospital Costs and Quality Information
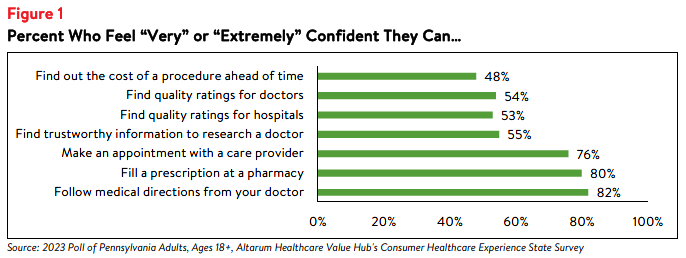
Pennsylvania respondents reported fairly high levels of confidence in the ability to navigate typically
common tasks such as making an appointment with a primary care provider, following medical directions
given by a provider, or filling a prescription at a pharmacy. However, they were less confident in
navigating other tasks such as finding out the cost of a procedure ahead of time, finding quality ratings for
doctors, or finding quality ratings for hospitals (see Figure 1). Understanding the cost of hospital care is
important in part because many people must pay for their care independently until they reach their
deductible. The average Pennsylvania family deductible was $3,301 as of 2022 and $1,814 for individuals.1 Navigating hospital care includes knowing how much care will cost, particularly when one may be expected to pay for the full cost of care all at once up to thousands of dollars.
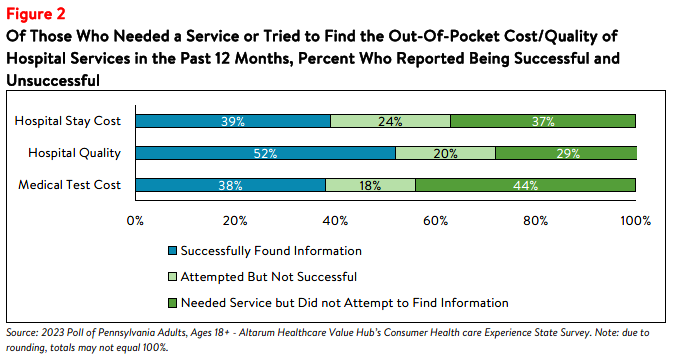
Pennsylvania respondents’ lack of confidence may be reflected in the low rates of searching for hospital
price and quality information. Out of all respondents, only 27% tried to find the cost of a hospital stay
ahead of time. Out of those respondents who tried to find hospital cost information or needed a hospital
stay, only 39% reported finding the information they were looking for, while 24% reported they did not
find the information they were looking for and 37% did not attempt to find cost information when they
needed a hospital (see Figure 2). This suggests that this information may be hard to find and/or not
desirable to pursue for other reasons.
Thirty-nine percent of all respondents reported that they have tried to find quality information on
hospitals. Out of those respondents who tried to find hospital quality information or needed a hospital
stay, 52% were successful at finding quality information, 20% were unsuccessful and 29% did not attempt
to find quality information when they needed a hospital (see Figure 1). Figure 1 also captures other health
care costs integral to hospital services, including medical tests.
Motivation and Barriers to Accessing Cost and Quality Information
Among respondents who needed a service but did not seek out price or quality information, the most
frequently reported reasons for not seeking information were:
- 37%—Followed their doctors’ recommendations or referrals
- 23%—Did not know where to look
- 23%—Looking for information felt confusing or overwhelming
- 22%—It never occurred to me to look for provider quality or price information
- 17%—Did not have time to look
Notably, few of these respondents reported that out-of-pocket cost or quality were unimportant to them
(12% and 6%, respectively).
Respondents who attempted to find hospital cost or quality information but were unsuccessful faced a
variety of barriers. Among those who were unsuccessful at searching for cost information, respondents
reported that resources available to search for price information were confusing (41%), their insurance
plan or provider/doctor/hospital would not give them a price estimate (32% and 29%, respectively) and
that price information was insufficient (32%). In unsuccessful searches for hospital quality information,
respondents reported that resources available to search for quality information were confusing (28%) and
that the quality information available was not sufficient (19%).
Comparing Cost and Quality Across Hospitals
Among those who were successful at finding hospital cost or quality information, over half (55%) did not
attempt to compare prices between providers and 54% did not compare quality information between
providers (i.e. “shopping) (see Figure 3). Still, 40% successfully compared cost between hospitals, and 41% successfully compared quality between hospitals.
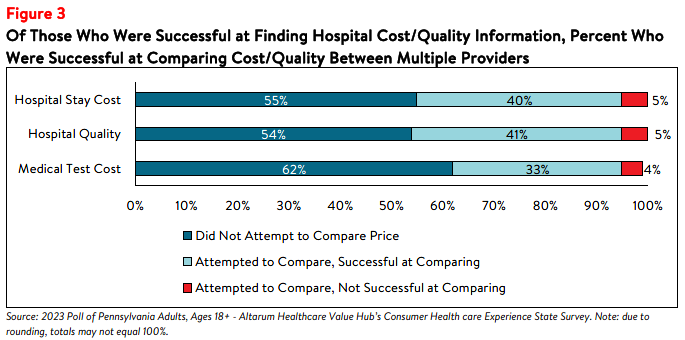
Among those that compared cost or quality information for different services, many reported that the
cost or quality comparison ultimately influenced their choice of which provider to seek care from. Eighty-
seven percent of respondents who compared medical test costs and 86% of those who compared hospital
stay costs said that comparison shopping influenced their choice. Among those who looked for hospital
quality information, 90% had their choice influenced by the information.
Although many of the respondents who sought out hospital price and quality information were ultimately
successful, many respondents never attempted to find this information. Even among those who were
successful at finding hospital cost or quality information, a little over half did not compare prices or
quality between providers (i.e. “shopping”). Respondents identified a variety of barriers to finding and
comparing cost and quality information, including following doctors’ recommendations, confusion over
where or how to find cost or quality information, and providers and insurers not providing cost estimates.
These reasons could also be influenced by this information not being accessible, despite federal price
transparency mandates for hospitals.2
It could also stem from the fact that some consumers don’t view health care as a shoppable commodity,
especially in emergency situations and settings that lack a selection of treatments/providers. Lack of
knowledge of hospital quality and potential costs impedes Pennsylvania residents’ ability to plan for
needed care and budget for the expense of a hospital stay, which can be costly,3 particularly for residents
who are uninsured or under-insured.
Support for “Fixes” across Party Lines
Hospitals, along with drug manufacturers and insurance companies, are viewed as a primary contributor to high health care costs. When given more than 20 options, those that Pennsylvania respondents most
frequently cited as being a “major reason” for high health care costs were:
- 74%—Drug companies charging too much money
- 73%—Hospitals charging too much money
- 70%—Insurance companies charging too much money
- 57%—Large hospitals or doctor groups using their influence to get higher payments from insurance companies
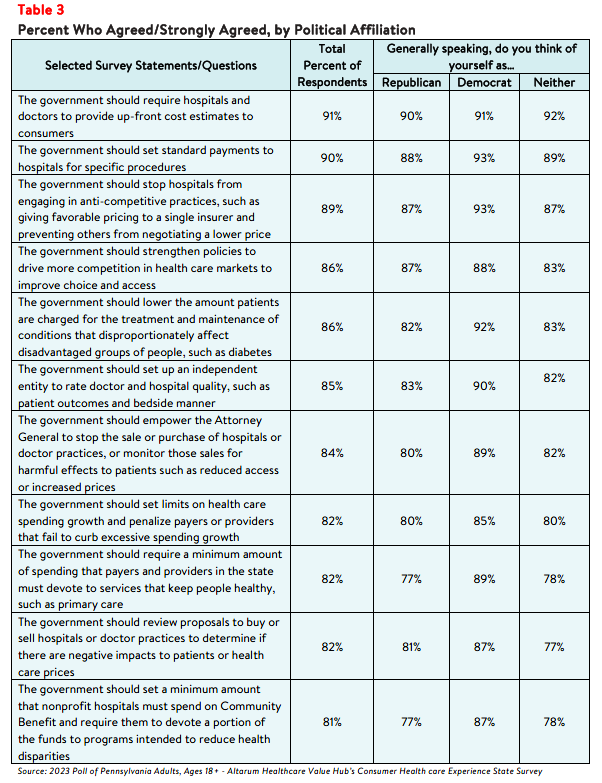
Pennsylvania respondents strongly endorse several hospital-related strategies, including:
- 91%—Require hospitals and doctors to provide up-front cost estimates to consumers
- 90%—Set standard payments to hospitals for specific procedures
- 89%—Stop hospitals from engaging in anti-competitive practices, such as giving favorable pricing to a single insurer and preventing others from negotiating a lower price
- 87%—Impose price controls on contracts between insurers and health care providers
- 86%—Strengthen policies to drive more competition in health care markets to improve choice and access
- 84%—Empower the Attorney General to stop the sale or purchase of hospitals or doctor practices, or monitor those sales for harmful effects to patients such as reduced access or increased prices
- 82%—Review proposals to buy or sell hospitals or doctor practices to determine if there are negative impacts to patients or health care prices
What’s even more interesting is the level of support for some of these strategies across party lines (see
Table 3).
Conclusion
The findings from this survey suggest that Pennsylvania respondents are somewhat motivated when it
comes to searching for hospital cost and quality information to help inform purchasing decisions and plan
for future medical expenses. Still, over half did not search for this information at all, suggesting that effort
to influence consumer shopping through price transparency initiatives may not be effective for everyone.
It is not surprising that Pennsylvania respondents express strong support for government-led solutions to
make price and quality information more readily accessible and to help consumers navigate hospital care.
Many of the solutions that respondent’s support would take the burden of research and guesswork off
consumers, such as standardizing payments for specific hospital procedures, requiring hospitals and
doctors to provide consumers cost estimates for certain procedures, and establishing an entity to conduct
independent quality reviews. Policymakers should investigate the evidence on these and other policy
options to respond to respondents’ bipartisan call for government action.
Notes
- Average Annual Deductible per Enrolled Employee in Employer-Based Health Insurance for Single and Family Coverage. KFF. https://www.kff.org/other/state-indicator/average-annual-deductible-per-enrolled-employee-in-employer-based-health-insurance-for-single-and-family-coverage/
- As of January 1, 2021, the Centers for Medicare and Medicaid Services (CMS) requires hospitals to make public a
machine-readable file containing a list of standard charges for all items and services provided by the hospital, as well as a consumer-friendly display of at least 300 shoppable services that a patient can schedule in advance. However, low compliance from large hospitals indicates that the rule has yet to demonstrate the desired effect. See: (1) https://www.cms.gov/hospital-price-transparency/hospitals and (2) Kelly, Susan, “Hospitals Still Fall Short on Price Transparency, Consumer Group Says,” Health care Dive (Aug. 10, 2023). See also: Kurani, Nisha, et al., Early Results from Federal Price Transparency Rule Show Difficulty in Estimating the Cost of Care, Kaiser Family Foundation, (April 9, 2021). - According to Health Forum, an affiliate of the American Hospital Association, hospital adjusted expenses per inpatient day in Pennsylvania were $2,825 in 2021, similar to the national average. See: Kaiser Family Foundation, State Health Facts Data: Hospital Adjusted Expenses per Inpatient Day. Accessed August 31, 2023. https://www.kff.org/health-costs/state-indicator/expenses-per-inpatient-day/
Methodology
Altarum’s Consumer Health care Experience State Survey (CHESS) is designed to elicit respondents’ unbiased views on a widerange of health system issues, including confidence using the health system, financial burden and possible policy solutions.
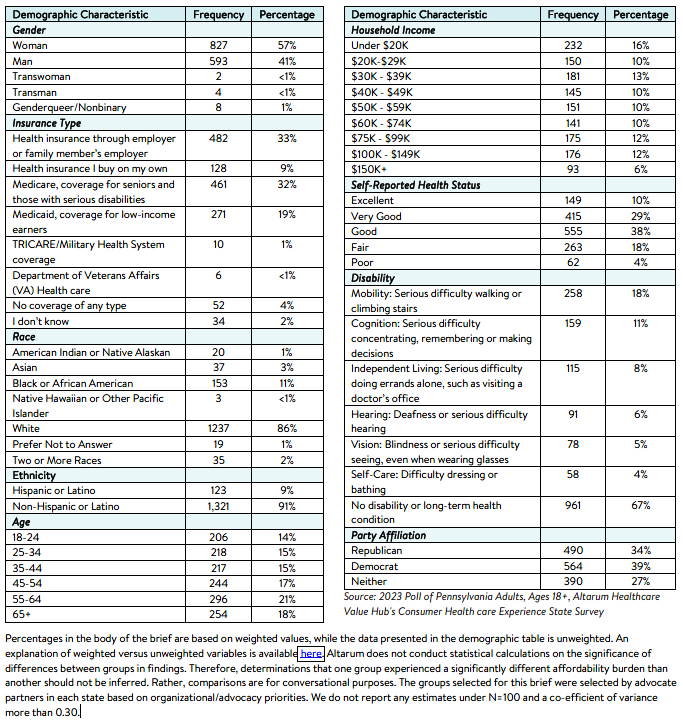
This survey, conducted from July 11 to July 24, 2023, used a web panel from online survey company Dynata with a sample of approximately 1,500 respondents who live in Pennsylvania. Data was cleaned and weighted to the appropriate demographic balance of the state. While this survey is not generalizable to the entire state, it does allow for important insights into a balanced sample of adults in Pennsylvania. Information about Dynata’s recruitment and compensation methods can be found here. The survey was conducted in English or Spanish and restricted to adults ages 18 and older. Respondents who finished the survey in less than half the median time were excluded from the final sample, leaving 1,444 cases for analysis. After those exclusions, the demographic composition of respondents was as follows, although not all demographic information has complete response rates:

Pennsylvania Survey Reports
2023
Statewide Reports
Prescription Drug Affordability
2021
Statewide Reports
Prescription Drug Affordability
2018
Statewide Reports
Regional Reports
Northeast/North Central Region
South Central/Lehigh Valley Region
Report Download
|
HEALTHCARE VALUE HUB
The Healthcare Value Hub can help you find free, timely information about policies and practices to achieve health systems that are equitable, affordable, and focused on the goals and needs of the people the system is meant to serve.
Share
![]()
![]()
![]()

Follow
![]()
![]()


![]()