Pennsylvania Survey Respondents Worry about High Drug Costs & Support a Range of Government Solutions
A demographically balanced survey of more than 1,400 Pennsylvania adults, conducted from July 11 to
July 24, 2023, found that:
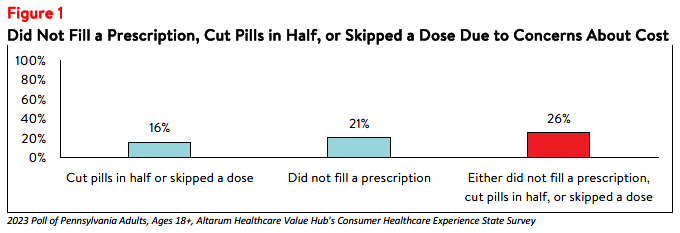
- Over 1 in 4 respondents (26%) reported rationing medication due to cost;
- More than half (55%) of survey respondents reported being somewhat or very worried about affording the cost of prescription drugs;
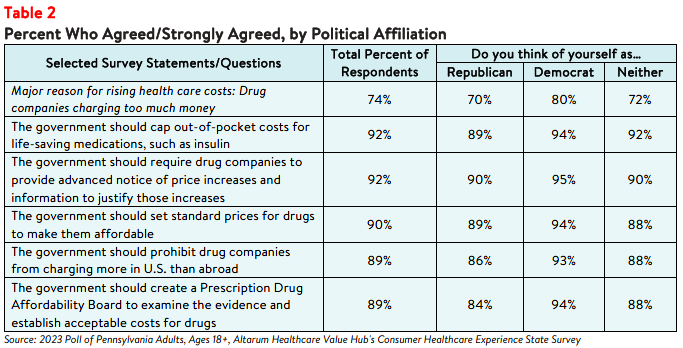
- Nearly 3 in 4 respondents (74%) thought drug companies charging too much money was a "major reason" for high health care costs; and
- Across party lines, respondents express strong support for government action, and multiple government policies had support from at least 85% of respondents.
According to a statewide survey with a demographically-balanced sample1 of more than 1,400
Pennsylvania adults, conducted from July 11 to July 24, 2023, respondents are concerned about
prescription drug costs and express a strong desire for policymakers to enact solutions.
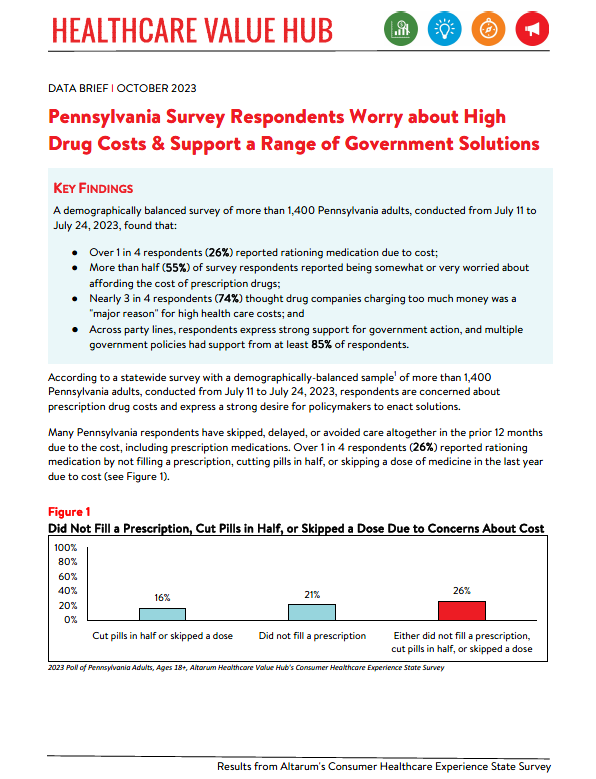
Many Pennsylvania respondents have skipped, delayed, or avoided care altogether in the prior 12 months
due to the cost, including prescription medications. Over 1 in 4 respondents (26%) reported rationing
medication by not filling a prescription, cutting pills in half, or skipping a dose of medicine in the last year
due to cost (see Figure 1).
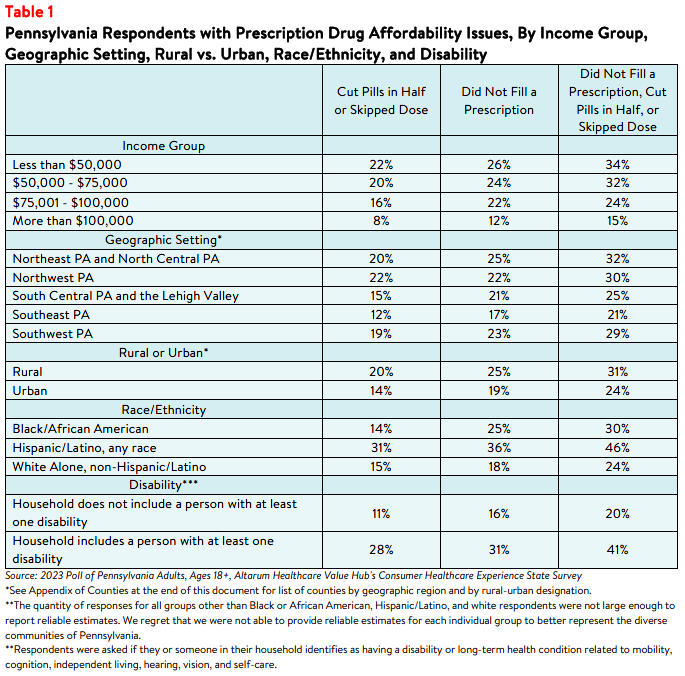
These hardships disproportionately impact people in lower-income households. Respondents living in
households earning less than $50,000 per year reported the highest rates of rationing their prescription
medicines, followed closely by those earning $50,000 to $75,000, compared to respondents living in
higher-income households (see Table 1). The median household income in Pennsylvania was $67,587 as of 2021.2 However, these hardships are prevalent in middle-income households as well. In addition, 31% of respondents living in rural areas rationed medication due to cost compared to 24% of respondents living in urban areas.
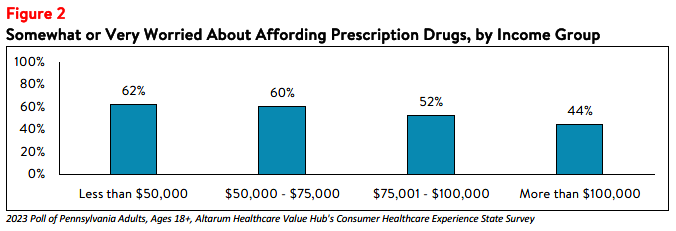
In addition to rationing medication in the last year, more than half (55%) of survey respondents reported
being somewhat or very worried about affording the cost of prescription drugs in the future. Worry varied
substantially by income group, with respondents in households making less than $50,000 per year experiencing the most worry (see Figure 2). However, it is important to note that a large share of
households making above $75,000 per year also reported worrying about prescription drugs.
Considering these prescription drug cost concerns—as well as concerns about high health care costs
generally3—it is not surprising that Pennsylvania respondents were generally dissatisfied with the health
system:
- Just 29% agreed or strongly agreed that “we have a great health care system in the U.S.,”
- While 72% agreed or strongly agreed that “the system needs to change.”
When given more than 20 options, the options cited most frequently as being a "major reason" for high
health care costs were:
- 74%—Drug companies charging too much money
- 73%—Hospitals charging too much money
- 70%—Insurance companies charging too much money
When it comes to tackling high drug costs, Pennsylvania respondents endorsed a number of prescription
drug-related strategies:
- 92%—Cap out-of-pocket costs for life-saving medications, such as insulin
- 92%—Require drug companies to provide advanced notice of price increases and information to justify those increases
- 90%—Set standard prices for drugs to make them affordable
- 89%—Prohibit drug companies from charging more in the U.S. than abroad
- 89%—Create a Prescription Drug Affordability Board to examine the evidence and establish acceptable costs for drugs
Moreover, there is support for government action on drug costs regardless of the respondent’s political
affiliation (see Table 2).
Conclusion
The high burden of health care and prescription drug affordability, along with high levels of support for
change, suggests that elected leaders and other stakeholders need to make addressing this consumer
burden a top priority. In addition, state surveys completed in 2018 and 2020 found that 19% did not fill a
prescription due to cost and 22% rationed medication due to cost in the last year, respectively,
demonstrating that prescription affordability continues to be a challenge for consumers. The last several
years have led state residents to take a hard look at how well health and public health systems are working for them, with strong support for a wide variety of actions. Annual surveys can help assess whether progress is being made.
Notes
- The survey was conducted statewide using a web-based panel, and data was cleaned and weighted to the appropriate demographic balance of the state of Pennsylvania. While this survey is not generalizable to the entire state, it does allow for important insights into a balanced sample of adults in Pennsylvania.
- Median household income in Pennsylvania was $67,587 (2017-2021). U.S. Census, Quick Facts. Retrieved from: U.S. Census Bureau QuickFacts
- For more detailed information about health care affordability burdens facing Pennsylvania respondents, please see
Healthcare Value Hub, Pennsylvania Survey Respondents Struggle to Afford High Health Care Costs; Worry About Affording Health Care in the Future; Support Government Action Across Party Lines, Data Brief (October 2023).
Appendix of Counties
Geographic Setting
Northeast and North Central PA: Bradford, Carbon, Centre, Clinton, Columbia, Juniata, Lackawanna, Luzerne, Lycoming, Mifflin, Monroe, Montour, Northumberland, Pike, Schuylkill, Snyder, Sullivan, Susquehanna, Tioga, Union, Wayne, Wyoming
Northwest PA: Cameron, Clarion, Clearfield, Crawford, Elk, Erie, Forest, Jefferson, McKean, Mercer, Potter, Venango, Warren
South Central PA and the Lehigh Valley: Adams, Berks, Cumberland, Dauphin, Franklin, Fulton, Huntingdon, Lancaster, Lebanon, Lehigh, Northampton, Perry, York
Southeast PA: Bucks, Chester, Delaware, Montgomery, Philadelphia
Southwest PA: Allegheny, Armstrong, Beaver, Bedford, Blair, Butler, Cambria, Fayette, Greene, Indiana, Lawrence, Somerset, Washington, Westmoreland
Rural-Urban Designation
Rural: Adams, Armstrong, Bedford, Blair, Bradford, Butler, Cambria, Cameron, Carbon, Centre, Clarion, Clearfield, Clinton, Columbia, Crawford, Elk, Fayette, Forest, Franklin, Fulton, Greene, Huntingdon, Indiana, Jefferson, Juniata, Lawrence, Lycoming, Mckean, Mercer, Mifflin, Monroe, Montour, Northumberland, Perry, Pike, Potter, Schuylkill, Snyder, Somerset, Sullivan, Susquehanna, Tioga, Union, Venango, Warren, Washington, Wayne, Wyoming
Urban: Allegheny, Beaver, Berks, Bucks, Chester, Cumberland, Dauphin, Delaware, Erie, Lackawanna, Lancaster, Lebanon, Lehigh, Luzerne, Montgomery, Northampton, Philadelphia, Westmoreland, York
Methodology
Altarum’s Consumer Healthcare Experience State Survey (CHESS) is designed to elicit respondents’ unbiased views on a wide range of health system issues, including confidence using the health system, financial burden and possible policy solutions.
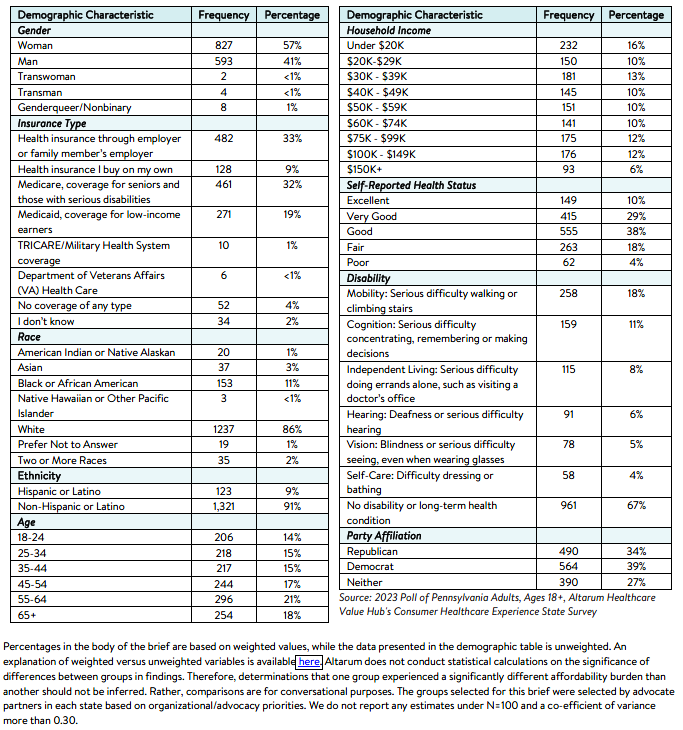
This survey, conducted from July 11 to July 24, 2023, used a web panel from online survey company Dynata with a sample of approximately 1,500 respondents who live in Pennsylvania. Data was cleaned and weighted to the appropriate demographic balance of the state. While this survey is not generalizable to the entire state, it does allow for important insights into a balanced sample of adults in Pennsylvania. Information about Dynata’s recruitment and compensation methods can be found here. The survey was conducted in English or Spanish and restricted to adults ages 18 and older. Respondents who finished the survey in less than half the median time were excluded from the final sample, leaving 1,444 cases for analysis. After those exclusions, the demographic composition of respondents was as follows, although not all demographic information has complete response rates:

Pennsylvania Survey Reports
2023
Statewide Reports
Prescription Drug Affordability
2021
Statewide Reports
Prescription Drug Affordability
2018
Statewide Reports
Regional Reports
Northeast/North Central Region
South Central/Lehigh Valley Region
Report Download
|
HEALTHCARE VALUE HUB
The Healthcare Value Hub can help you find free, timely information about policies and practices to achieve health systems that are equitable, affordable, and focused on the goals and needs of the people the system is meant to serve.
Share
![]()
![]()
![]()

Follow
![]()
![]()


![]()