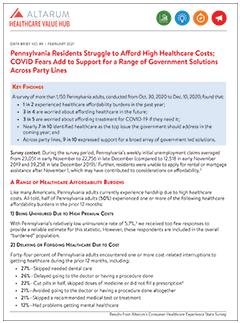
Pennsylvania Residents Struggle to Afford High Healthcare Costs; COVID Fears Add to Support for a Range of Government Solutions Across Party Lines
Key FindingsA survey of more than 1,150 Pennsylvania adults, conducted from Oct. 30, 2020 to Dec. 10, 2020, found that:
|
Survey context: During the survey period, Pennsylvania’s weekly initial unemployment claims averaged from 23,051 in early November to 22,756 in late December (compared to 12,518 in early November 2019 and 39,258 in late December 2019).1 Further, residents were unable to apply for rental or mortgage assistance after November 1, which may have contributed to considerations on affordability.2
A Range of Healthcare Affordability Burdens
Like many Americans, Pennsylvania adults currently experience hardship due to high healthcare costs. All told, half of Pennsylvania adults (50%) experienced one or more of the following healthcare affordability burdens in the prior 12 months:
1) Being Uninsured Due to High Premium Costs
With Pennsylvania’s relatively low uninsurance rate of 5.7%,3 we received too few responses to provide a reliable estimate for this statistic. However, these respondents are included in the overall “burdened” population.
2) Delaying or Forgoing Healthcare Due to Cost
Forty-four percent of Pennsylvania adults encountered one or more cost-related interruptions to getting healthcare during the prior 12 months, including:
- 27%—Skipped needed dental care
- 26%—Delayed going to the doctor or having a procedure done
- 22%—Cut pills in half, skipped doses of medicine or did not fill a prescription4
- 21%—Avoided going to the doctor or having a procedure done altogether
- 21%—Skipped a recommended medical test or treatment
- 12%—Had problems getting mental healthcare
Moreover, cost was by far the most frequently cited reason for not getting needed medical care, exceeding a host of other barriers like transportation, difficulty getting an appointment and lack of childcare.
Of the various types of medical bills, the ones most frequently associated with an affordability barrier were doctor bills, dental bills and prescription drugs, likely reflecting the frequency with which Pennsylvania adults seek these services—or, in the case of dental, perhaps lower rates of coverage for these services.
3) Struggling to Pay Medical Bills
Other times, Pennsylvania adults got the care they needed but struggled to pay the resulting bill. One in four Pennsylvania adults (25%) experienced one or more of these struggles to pay their medical bills:
- 10%—Contacted by a collection agency
- 8%—Used up all or most of their savings
- 7%—Unable to pay for basic necessities like food, heat or housing
- 6%—Racked up large amounts of credit card debt
- 6%—Borrowed money, got a loan or another mortgage on their home
- 5%—Placed on a long-term payment plan
High Levels of Worry About Affording Healthcare in the Future
Pennsylvania adults also exhibit high levels of worry about affording healthcare in the future. Overall, 3 in 4 adults (74%) report being “worried” or “very worried” about affording some aspect of healthcare in the future, including:
- 65%—Cost of affording nursing home or home healthcare
- 61%—Medical costs when elderly
- 60%—Health insurance will become too expensive
- 58%—Medical costs in the event of a serious illness or accident
- 50%—Cost of needed prescription drugs
While the two most common worries—affording the cost of nursing home or caregiving services and medical costs when elderly—are applicable solely to an older population, they were most frequently reported by respondents ages 35-44, followed by respondents ages 45-54. This finding indicates that residents may be worried about affording the cost of care for aging parents, in addition to themselves.
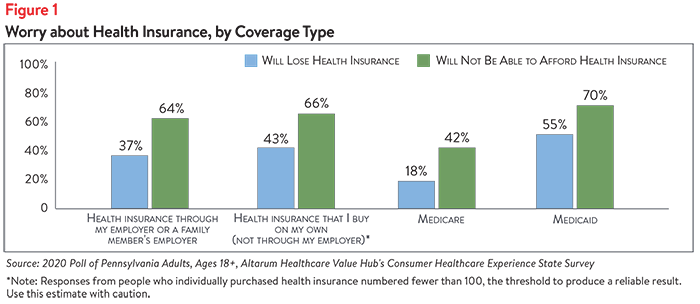
Furthermore, 38% of respondents of all ages are “worried” or “very worried” about losing their health insurance. These concerns vary by type of insurance coverage, with people who buy insurance on their own and those on Medicaid being most concerned about losing their coverage. Notably, residents with employer-sponsored coverage and those who bought insurance on their own had similar levels of worry about losing and affording coverage. Concerns about affording health insurance exceeded fears about losing coverage across all insurance types (see Figure 1).
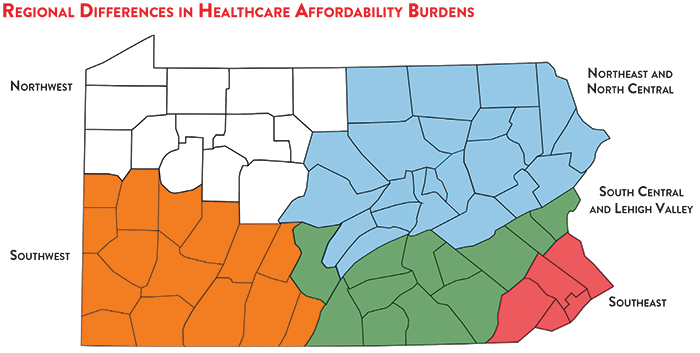
The survey also revealed regional differences in how Pennsylvania adults experience healthcare affordability burdens.
Affordability burdens affect families in every region of Pennsylvania, with 68% of residents in the Northwest region facing healthcare affordability burdens—the highest in the state (see Figure 2). Not surprisingly, rural residents experienced healthcare affordability burdens at higher rates than those in other areas of the state. Nearly 6 in 10 rural adults (57%) experienced affordability burdens, compared to nearly 5 in 10 adults (47%) in other areas.
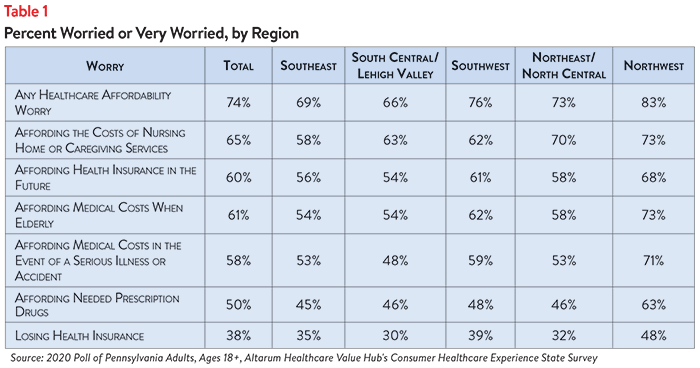
Worries about affording healthcare in the future are also high throughout the state. Though residents in the Northwest region reported the highest levels of worry, a vast majority of adults in the other regions of Pennsylvania report being worried, as well (see Table 1).

COVID Worries
In addition to affordability worries, Pennsylvania adults were asked about their top worries related to the COVID crisis.5 When asked about “affording treatment of coronavirus/COVID-19 if you need it,” 59% of respondents were worried or very worried.
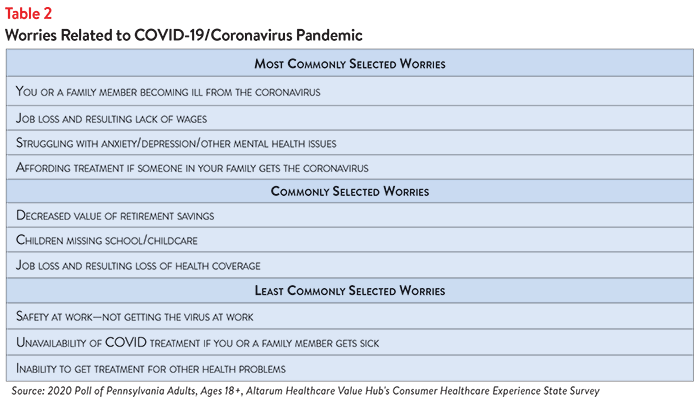
Separately, out of twelve possible responses, respondents were asked to pick the top three things they were most worried about (see Table 2). “Becoming ill from the virus” was not only the most frequently selected by respondents, but it exceeded other worries by a wide margin. Fifty-six percent of respondents selected “Becoming ill from the virus” as one of their top three concerns, while 27% of respondents selected the next most common worry, “Job loss and resulting lack of wages,” as a top three concern.
In smaller numbers, Pennsylvania adults worried about many other issues, including: children missing school/child care (20%), job loss and resulting loss of health coverage (19%), safety at work–not getting the virus at work (19%), unavailability of COVID treatment if they or their family member gets sick (16%), inability to get treatment for other health problems (16%) and something else (14%).
Dissatisfaction with the Health System and Support for Change
In light of these healthcare affordability and COVID concerns, it is not surprising that Pennsylvania adults were extremely dissatisfied with the health system. Statewide:
- Just 34% agreed or strongly agreed that “we have a great healthcare system in the U.S.,”
- While 68% agreed or strongly agreed that “the system needs to change.”
The survey asked about both personal and governmental actions to address health system problems.
Personal Actions
Pennsylvania adults do see a role for themselves in addressing healthcare affordability. Respondents reported specific actions they have already taken, like researching the cost of a drug beforehand (52%), as well as action they should be taking—78% said they would switch from a brand name to a less expensive generic drug if given a chance.
When asked to select the top three personal actions that would be most effective in addressing the affordability of healthcare (out of ten options), the most common responses were: “take better care of my personal health” (70%); “research treatments myself, before going to the doctor” (36%); “write or call my STATE representative asking them to take action” (34%); and “write or call my FEDERAL representative asking them to take action” (33%).
Government Actions
But far and away, Pennsylvania residents see government as the key stakeholder that needs to act to address health system problems. Moreover, addressing healthcare problems was a higher priority than other issues that Pennsylvania residents want their elected representatives to work on.
At the beginning of the survey, respondents were asked what issues the government should address in the upcoming year. The top vote getters were:
- 67%—Healthcare
- 66%—Economy/Joblessness
- 43%—Taxes
The economic woes brought on by the COVID crisis likely contributed to “Economy/Joblessness” as a primary concern, but addressing healthcare remained the top issue that Pennsylvania adults want their elected representatives to work on.
When asked about the top three healthcare priorities the government should work on, top vote getters were:
- 51%—Address high healthcare costs, including prescription drugs6
- 40%—Preserve consumer protections preventing people from being denied coverage or charged more for having a pre-existing medical condition
- 31%—Get health insurance to those who cannot afford coverage
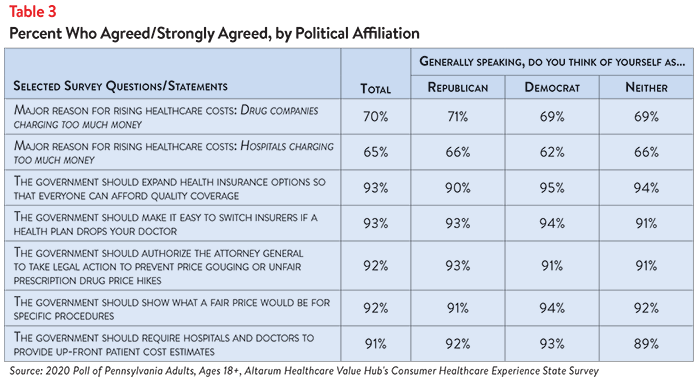
Of more than 20 options, Pennsylvania adults believe the reason for high healthcare costs is unfair prices charged by powerful industry stakeholders:
- 70%—Drug companies charging too much money
- 65%—Insurance companies charging too much money
- 65%—Hospitals charging too much money
When it comes to tackling costs, respondents endorsed a number of strategies, including:
- 93%—Expand health insurance options so that everyone can afford quality coverage
- 93%—Make it easy to switch insurers if a health plan drops your doctor
- 92%—Show what a fair price would be for specific procedures
- 92%—Ensure patients can’t be charged out-of-network prices if they encounter an out-of-network provider through no fault of their own
Support for Action Across Party Lines
What is remarkable about the findings is high support for change regardless of respondents’ political affiliation (see Table 3).
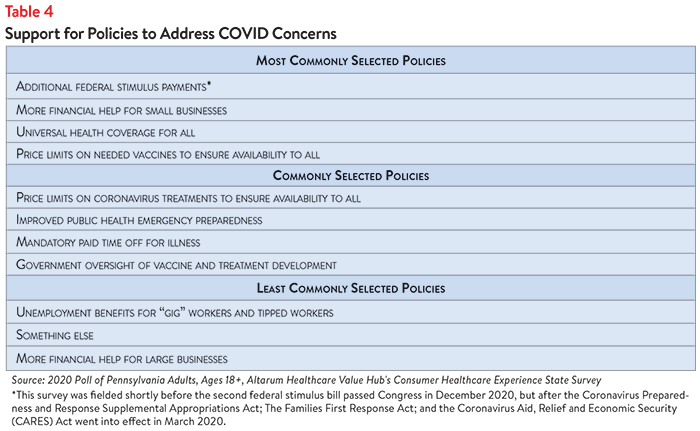
Policies to Address COVID Concerns
In addition to residents’ views on the policies and approaches below, new questions were asked about support for and against policies related to the COVID crisis. Out of 11 possible responses, respondents were asked to pick the top three policies that would help address COVID-related problems. There was significant diversity in the policies supported, with the highest percentages of respondents selecting “Additional Federal stimulus” and “More financial help for small businesses” as a top three priority. The next most supported policies received nearly equal levels of support (see Table 4). “More financial help for large businesses” received the least support, as it was a priority for only a small percentage of respondents.
The high burden of healthcare affordability, along with high levels of support for change, suggest that elected leaders and other stakeholders need to make addressing this consumer burden a top priority. Moreover, the current COVID crisis is leading state residents to take a hard look at how well health and public health systems are working for them, with strong support for a wide variety of actions. Annual surveys can help assess whether or not progress is being made.
Comparing 2021 Results to the 2018 CHES Survey
We caution readers against drawing strong conclusions about changes observed between the 2018 and 2021 CHES surveys. While the findings from the two surveys are remarkably consistent, small
differences in the weighting approach and in the instrument itself (most significantly the addition of the COVID questions) indicate that direct comparisons should not be made. For more information on the Pennsylvania state surveys, go to www.healthcarevaluehub.org/pennsylvania-state-survey.
Notes
1. Pennsylvania’s Office of Unemployment Compensation, Unemployment Compensation Claim Statistics & COVID-19 (accessed on Jan. 20, 2021).
2. Pennsylvania’s Office of the Governor, Order of the Governor of the Commonwealth of Pennsylvania Staying the Application Deadline Under the COVID Relief Mortgage and Rental Assistance Grant Program. (October 2020).
3. Kaiser Family Foundation, Health Insurance Coverage of the Total Population, 2019.
4. Of the current 44% of Pennsylvania adults who encountered one or more cost-related interruptions to getting healthcare during the prior 12 months, 17% did not fill a prescription, while 14% cut pills in half or skipped doses of medicine due to cost.
5. COVID-19 is the disease caused by the coronavirus, which was characterized as a pandemic by the World Health Organization on March 11, 2020. For a comparison of how respondents from Connecticut, Kentucky, Mississippi and New Jersey answered our COVID questions, please see Healthcare Value Hub, How COVID Has Shaped Residents’ Broader Attitudes Towards the Health System, Data Brief No. 86.
6. To learn more about Pennsylvania residents’ worries and support for solutions to address high prescription drug costs, see Healthcare Value Hub, Pennsylvania Residents Worried about High Drug Costs; Support a Range of Government Solutions, Data Brief No. 90 (forthcoming).
Funding
This survey was conducted for the Community Voices for Health project, supported by the Robert Wood Johnson Foundation and in collaboration with Public Agenda. For more information on Community Voices for Health, visit www.communityvoicesforhealth.org.
Methodology
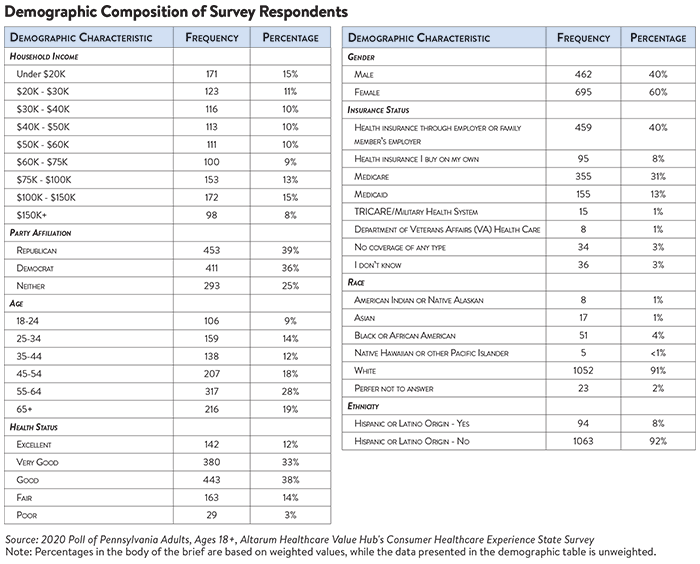
Altarum’s Consumer Healthcare Experience State Survey (CHESS) is designed to elicit respondents’ unbiased views on a wide range of health system issues, including confidence using the health system, financial burden and views on fixes that might be needed.
The survey used a web panel from Dynata with a demographically balanced sample of approximately 1,250 respondents who live in Pennsylvania. The survey was conducted only in English and Spanish and was restricted to adults ages 18 and older. Respondents who finished the survey in less than half the median time were excluded from the final sample, leaving 1,157 cases for analysis. After those exclusions, the demographic composition of respondents was as follows, although not all demographic information has complete response rates:

Pennsylvania Survey Reports
2023
Statewide Reports
Prescription Drug Affordability
2021
Statewide Reports
Prescription Drug Affordability
2018
Statewide Reports
Regional Reports
Northeast/North Central Region
South Central/Lehigh Valley Region
Report Download
|
HEALTHCARE VALUE HUB
The Healthcare Value Hub can help you find free, timely information about policies and practices to achieve health systems that are equitable, affordable, and focused on the goals and needs of the people the system is meant to serve.
Share
![]()
![]()
![]()

Follow
![]()
![]()


![]()