
Connecticut Survey Reports
2022
2020
2018
Difficulties Navigating Healthcare
Prescription Drugs Affordability
Infographic
|
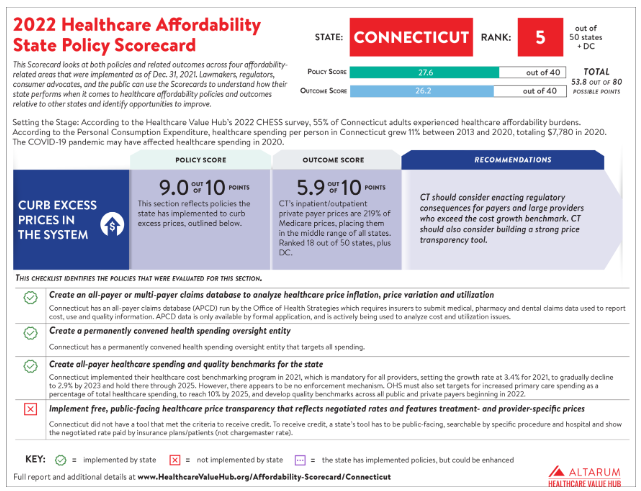
connecticut healthcare affordability scorecard
|
State News
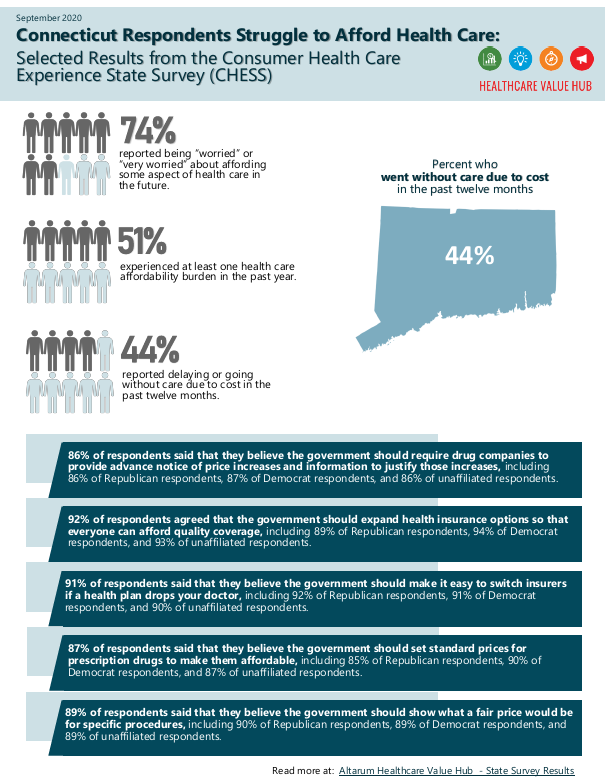
Connecticut Consumer Healthcare Experience State Survey
A survey of more than 1,300 Connecticut adults, conducted from July 22 to August 12, 2022, found that:
- Over half (55%) experienced at least one healthcare affordability burden in the past year;
- Nearly 4 in 5 (78%) worry about affording healthcare in the future;
- Lower-income respondents and respondents with disabilities are more likely to go without care and incur debt due to healthcare costs; and
- Across party lines, respondents express strong support for government-led solutions.
Altarum’s Consumer Healthcare Experience State Survey (CHESS) is designed to elicit respondents’ unbiased views on a wide range of health system issues, including confidence using the health system, financial burden and views on fixes that might be needed.
Below are Data Briefs with statewide survey results.
2022 Data Briefs
2020 Data Briefs
2018 Data Briefs
HEALTHCARE VALUE HUB
The Healthcare Value Hub can help you find free, timely information about policies and practices to achieve health systems that are equitable, affordable, and focused on the goals and needs of the people the system is meant to serve.
Share
![]()
![]()
![]()

Follow
![]()
![]()


![]()