Utah Residents Worried about High Drug Costs–Support a Range of Government Solutions
According to a survey of more than 1,000 Utah adults conducted from August 28 to September 14, 2018, there is great concern about prescription drug costs and a desire to enact solutions.
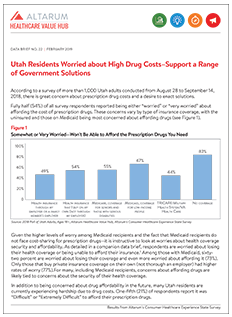
Fully half (54%) of all survey respondents reported being either “worried” or “very worried” about affording the cost of prescription drugs. These concerns vary by type of insurance coverage, with the uninsured and those on Medicaid being most concerned about affording drugs (see Figure 1).
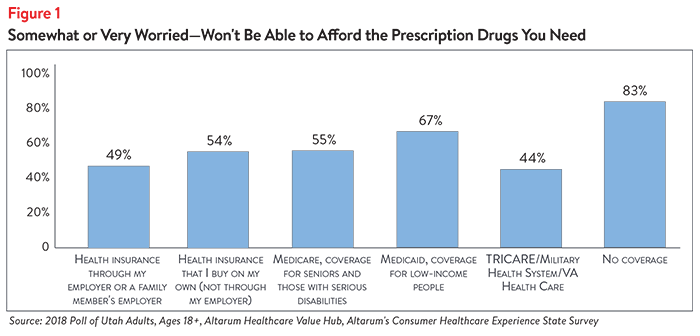
Given the higher levels of worry among Medicaid recipients and the fact that Medicaid recipients do not face cost-sharing for prescription drugs—it is instructive to look at worries about health coverage security and affordability. As detailed in a companion data brief, respondents are worried about losing their health coverage or being unable to afford their insurance.1 Among those with Medicaid, sixty-two percent are worried about losing their coverage and even more worried about affording it (73%). Only those that buy private insurance coverage on their own (not thorough an employer) had higher rates of worry (77%).For many, including Medicaid recipients, concerns about affording drugs are likely tied to concerns about the security of their health coverage.
In addition to being concerned about drug affordability in the future, many Utah residents are currently experiencing hardship due to drug costs. One-fifth (21%) of respondents report it was “Difficult” or “Extremely Difficult” to afford their prescription drugs.
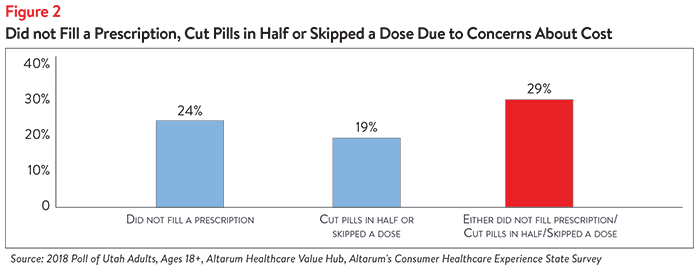
Indeed, cost concerns lead 29% of respondents (or someone in their household) to not fill a prescription or to cut pills in half (see Figure 2).
In light of these prescription drug cost concerns—as well as concern about high healthcare costs generally—it is not surprising that Utah residents are extremely dissatisfied with the health system:
- Only 26% agree or strongly agree with the statement “We have a great healthcare system in the U.S.”
- While 77% agree or strongly agree “the system needs to change.”
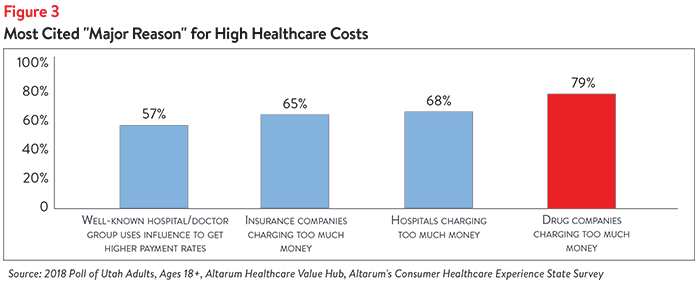
When given more than 20 options, the option cited most frequently as being a “major reason” for high healthcare costs were drug companies charging too much money (see Figure 3).
When it comes to tackling high drug costs specifically, respondents endorsed a number of strategies:
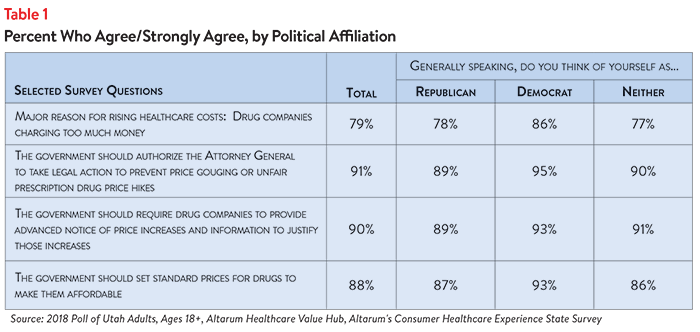
- 91%—Authorize the Attorney General to take legal action to prevent price gouging or unfair prescription drug price hikes
- 90%—Require drug companies to provide advanced notice of price increases and information to justify those increases
- 88%—Set standard prices for drugs to make them affordable
What is remarkable about the findings is high support for change regardless of the respondent’s political affiliation (see Table 1).
While Utah residents are united in calling for a role for government in addressing high drug costs, they also see a role for themselves:
- 90% would switch from a brand to a generic if given the option
- 57% have tried to find out the cost of a drug beforehand
1. Healthcare Value Hub, Utah Residents Struggle to Afford High Healthcare Costs; Express Support for a Range of Government Solutions Across Party Lines, Data Brief No. 20 (February 2019). http://www.healthcarevaluehub.org/Utah-2018-state-survey/
Methodology
Altarum’s Consumer Healthcare Experience State Survey (CHESS) is designed to elicit respondents’ unbiased views on a wide range of health system issues, including confidence using the health system, financial burden, and views on fixes that might be needed.
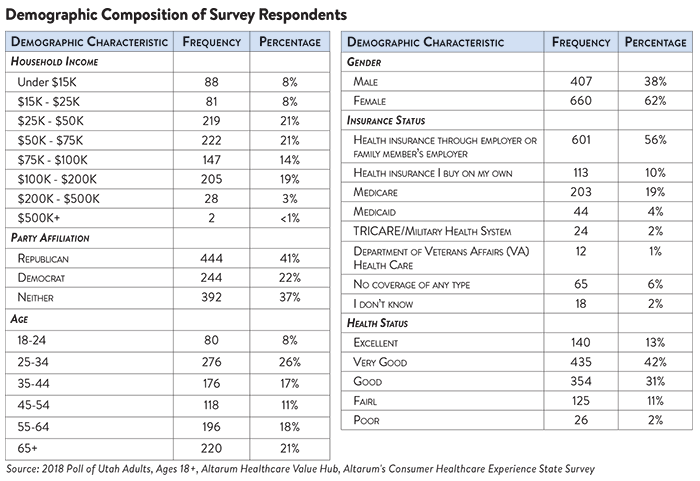
The survey used a web panel from SSI Research Now containing a demographically balanced sample of approximately 1,000 respondents who live in Utah. The survey was conducted only in English and restricted to adults ages 18 and older. Respondents who finished the survey in less than half the median time were excluded from the final sample, leaving 1,080 cases for analysis with weighting occurring in age, gender and income to be demographically representative of Utah. After those exclusions, the demographic composition of respondents in found in the table below.

HEALTHCARE VALUE HUB
The Healthcare Value Hub can help you find free, timely information about policies and practices to achieve health systems that are equitable, affordable, and focused on the goals and needs of the people the system is meant to serve.
Share
![]()
![]()
![]()

Follow
![]()
![]()


![]()