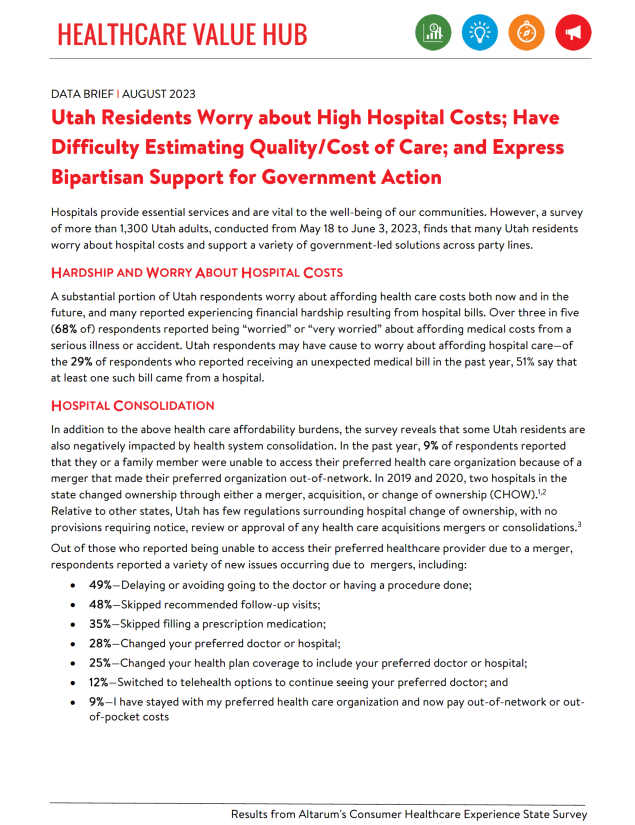
Utah Residents Worry about High Hospital Costs; Have Difficulty Estimating Quality/Cost of Care; and Express Bipartisan Support for Government Action
Hospitals provide essential services and are vital to the well-being of our communities. However, a survey
of more than 1,300 Utah adults, conducted from May 18 to June 3, 2023, finds that many Utah residents
worry about hospital costs and support a variety of government-led solutions across party lines.
Hardship and Worry about Hospital Costs
A substantial portion of Utah respondents worry about affording health care costs both now and in the
future, and many reported experiencing financial hardship resulting from hospital bills. Over three in five
(68% of) respondents reported being “worried” or “very worried” about affording medical costs from a
serious illness or accident. Utah respondents may have cause to worry about affording hospital care—of
the 29% of respondents who reported receiving an unexpected medical bill in the past year, 51% say that
at least one such bill came from a hospital.
Hospital Consolidation
In addition to the above health care affordability burdens, the survey reveals that some Utah residents are
also negatively impacted by health system consolidation. In the past year, 9% of respondents reported
that they or a family member were unable to access their preferred health care organization because of a
merger that made their preferred organization out-of-network. In 2019 and 2020, two hospitals in the
state changed ownership through either a merger, acquisition, or change of ownership (CHOW).1,2
Relative to other states, Utah has few regulations surrounding hospital change of ownership, with no
provisions requiring notice, review or approval of any health care acquisitions mergers or consolidations.3
Out of those who reported being unable to access their preferred healthcare provider due to a merger,
respondents reported a variety of new issues occurring due to mergers, including:
- 49%—Delaying or avoiding going to the doctor or having a procedure done;
- 48%—Skipped recommended follow-up visits;
- 35%—Skipped filling a prescription medication;
- 28%—Changed your preferred doctor or hospital;
- 25%—Changed your health plan coverage to include your preferred doctor or hospital;
- 12%—Switched to telehealth options to continue seeing your preferred doctor; and
- 9%—I have stayed with my preferred health care organization and now pay out-of-network or out-of-pocket costs
Out of those who reported that the merger caused some other type of burden for them or their families
(6% of all respondents), when asked about the greatest burden hospital mergers had created for
respondents and their families, respondents reported it created the following burdens:
- 32%—Added financial burden;
- 19%—Added wait time burden when searching for a new provider who is accepting new patients;
- 17%—Added transportation burden; and
- 16%—Created a gap in my continuity of care.
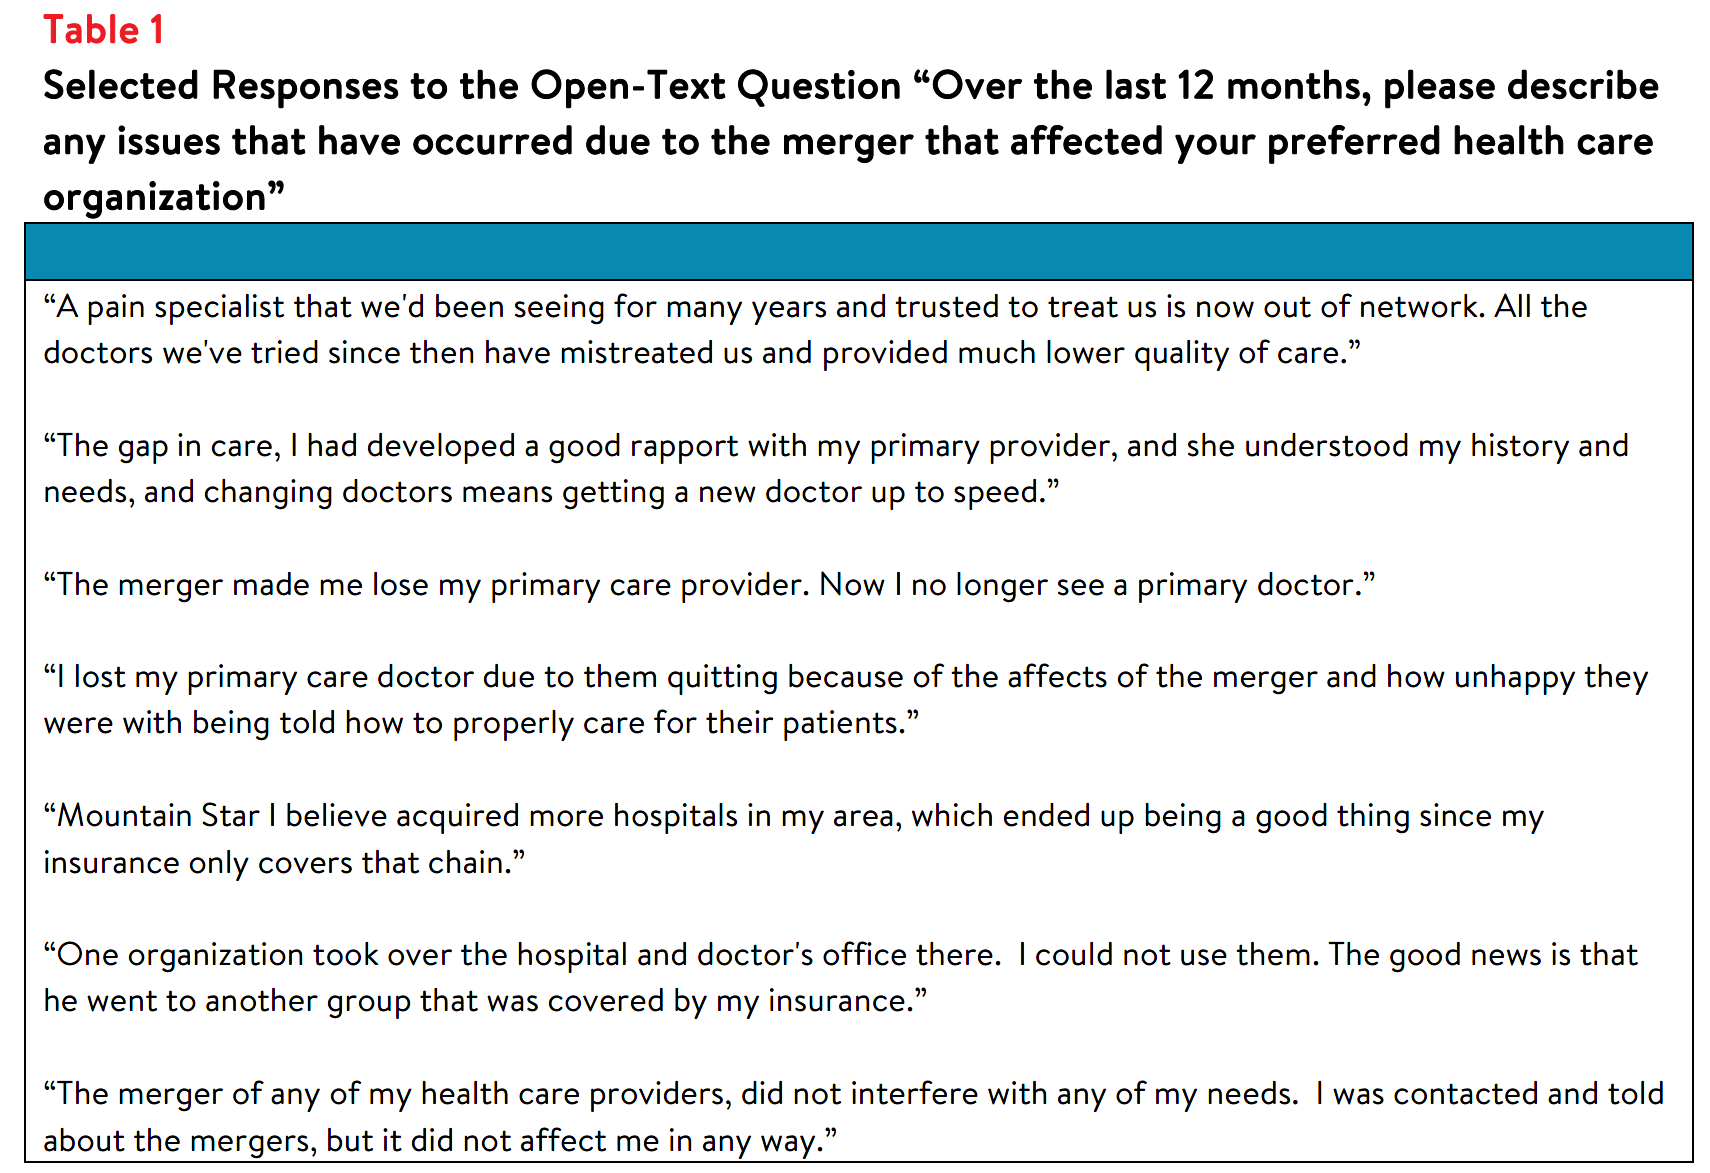
Survey respondents were also asked to share their experiences following hospital consolidation. Selected
responses are listed below in Table 1.
Skills Navigating Hospital Care
Utah respondents reported fairly high confidence in their ability to know when to seek emergency care,
with 64% reporting that they are very or extremely confident about knowing when to go to the
emergency department versus a primary care provider. However, they are slightly less confident in their
ability to find hospital costs and quality information. Fifty-five percent of respondents are NOT confident
they can find out the cost of a procedure ahead of time, and many are NOT confident they can find
quality ratings for doctors or hospitals (52% and 50%, respectively).
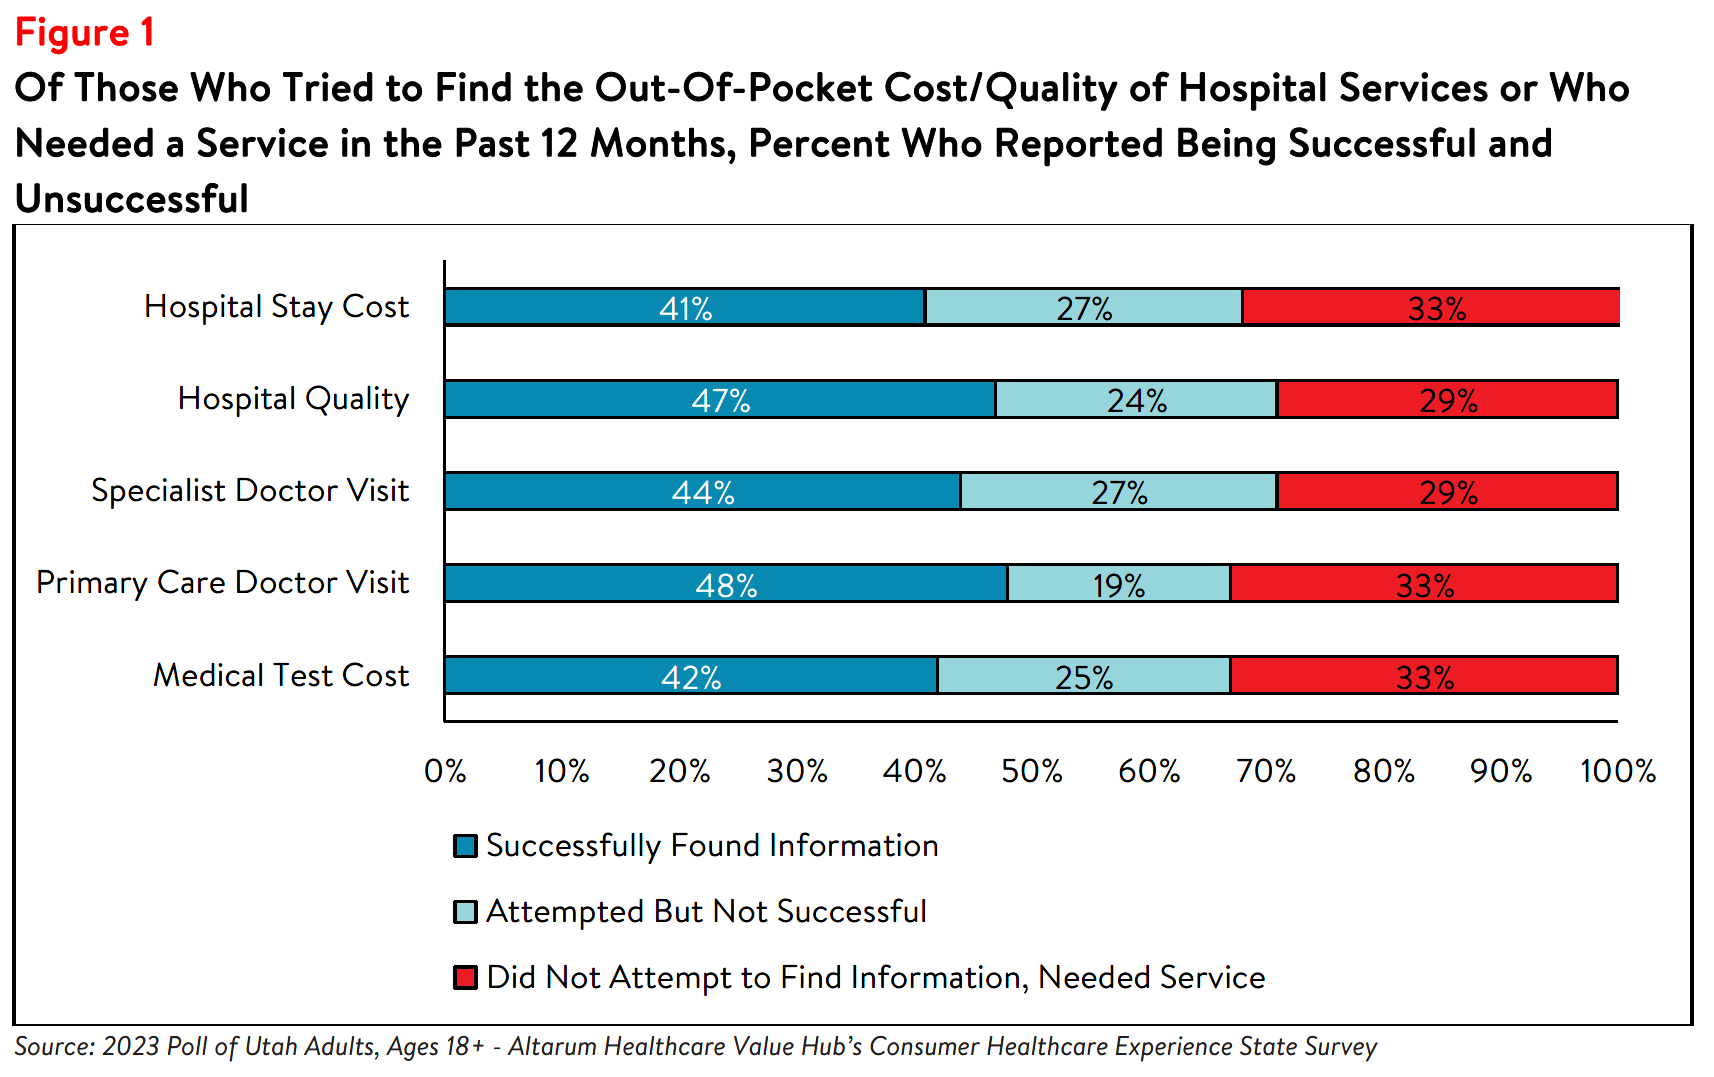
Utah respondents’ lack of confidence may be reflected in the low rates of searching for hospital price and
quality information. Out of all respondents, only 31% tried to find the cost of a hospital stay ahead of time and 15% needed a hospital stay but did not search for cost information. Out of those respondents whotried to find hospital cost information or needed a hospital stay, 41% reported finding the information
they were looking for, 27% reported they did not find the information they were looking for, and 33% did
not attempt to find information when they needed a hospital.
Forty percent of all respondents reported that they have tried to find quality information on hospitals and
17% needed a hospital but did not try to look for quality information. Out of those respondents who tried
to find hospital quality information or needed a hospital stay (but did not search for quality information),
47% were successful at finding quality information, 24% were unsuccessful and 29% did not attempt to
find quality information when they needed a hospital (see Figure 1). Figure 1 also captures other health
care costs integral to hospital services, including medical tests and primary care/specialist doctor visits.
Among respondents who needed a service but did not seek out price or quality information, the most
frequently reported reasons for not seeking information were:
- 35%—Did not know where to look
- 34%—Followed their doctors’ recommendations or referrals
- 28%—Looking for information felt confusing or overwhelming
- 24%—Did not have time to look
Notably, few of these respondents reported that out-of-pocket cost or quality were unimportant to them
(10% and 4%, respectively).
Respondents who attempted to find hospital cost or quality information but were unsuccessful faced a
variety of barriers. Among those who were unsuccessful at searching for cost information, respondents
reported that resources available to search for price information were confusing (43%), their insurance
plan or provider/doctor/hospital would not give them a price estimate (37% and 32%, respectively) and
that price information was insufficient (30%). In unsuccessful searches for hospital quality information,
respondents reported that resources available to search for quality information were confusing (31%) and
that the quality information available was not sufficient (20%).
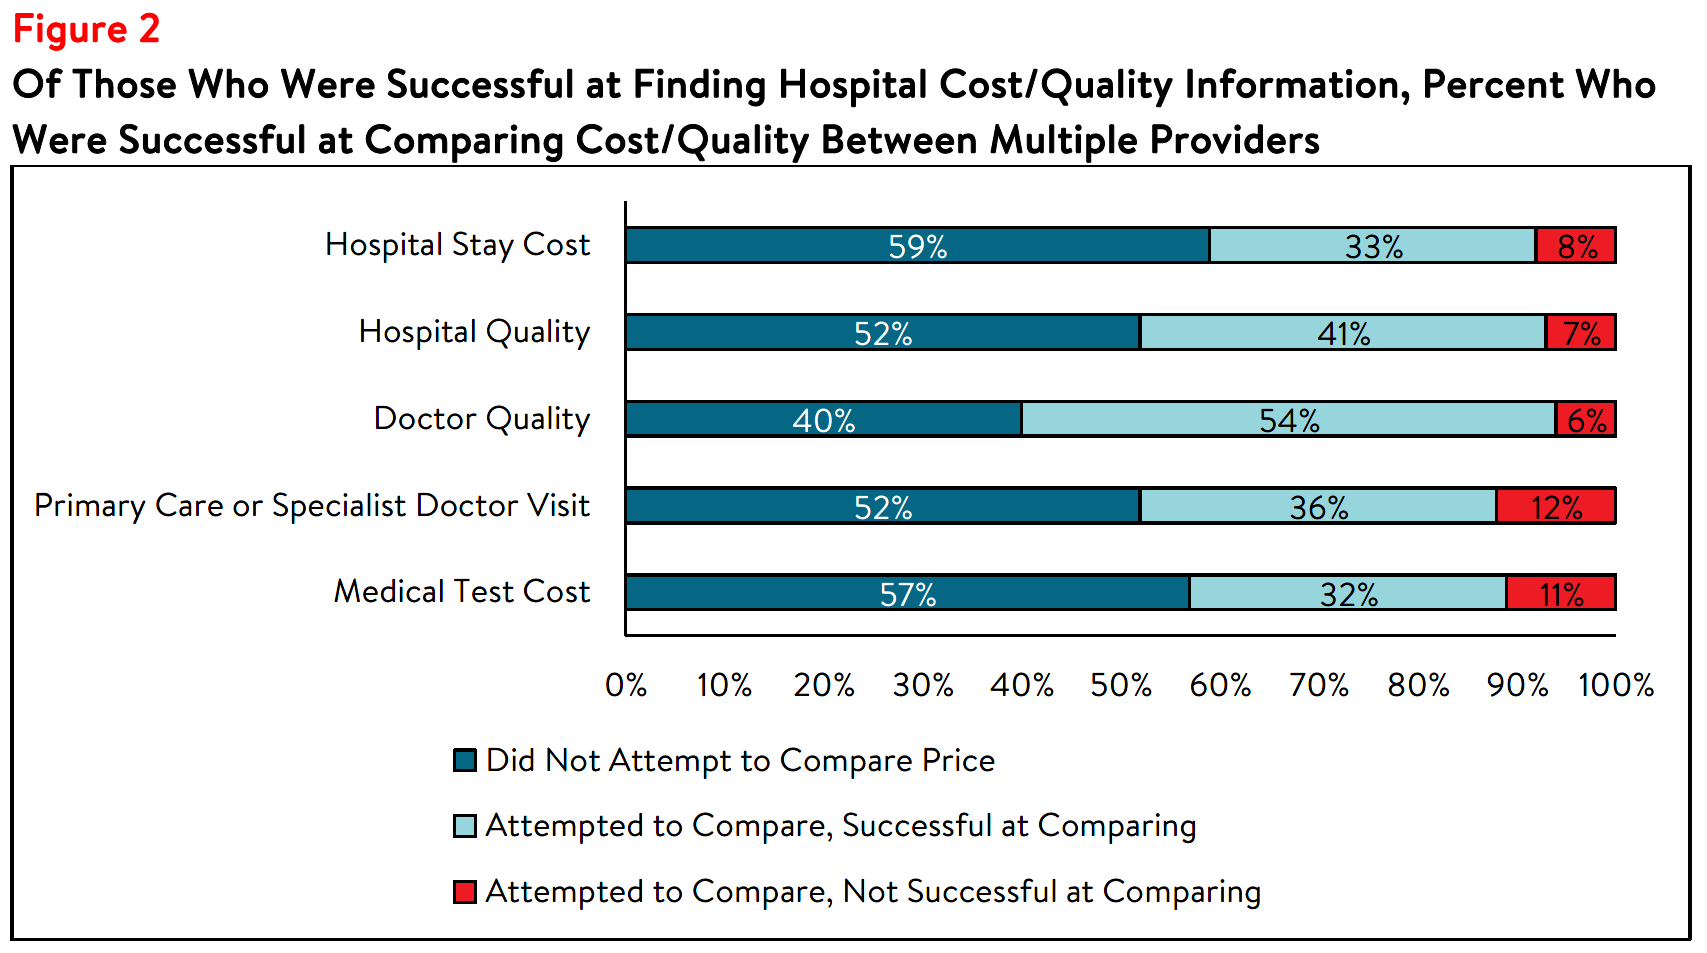
Among those who were successful at finding the cost for a hospital stay or quality information, over half
reported NOT attempting to compare prices or quality between providers (i.e. “shopping”) (see Figure 2).
Still, 33% successfully compared cost of a hospital stay, and 41% successfully compared quality across
hospitals.
Among those that compared cost or quality information for different services, many reported that the
cost or quality comparison ultimately influenced their choice of which provider to seek care from. Eighty-
four percent of those who compared primary care or specialist doctor visit costs, 83% of those who
compared medical test costs and 84% of those who compared hospital stay costs said the comparison
influenced their choice. Among those who looked for hospital quality information, 83% had their choice
influenced by the information.
Although many of the respondents who sought out hospital price and quality information were ultimately
successful, many respondents never attempted to find this information. Even among those who were
successful at finding hospital cost or quality information, a little over half did not compare prices or
quality between providers (i.e. “shopping”). Respondents identified a variety of barriers to finding and
comparing cost and quality information, including following doctors’ recommendations, confusion over where or how to find cost or quality information, and providers and insurers not providing cost estimates. These reasons could also be influenced by this information not being accessible, despite federal price transparency mandates for hospitals.4
It could also stem from the fact that some consumers don’t view health care as a shoppable commodity,
especially in emergency situations and settings that lack a selection of treatments/providers. Lack of
knowledge of hospital quality and potential costs impedes Utah residents’ ability to plan for needed care
and budget for the expense of a hospital stay, which can be costly,5 particularly for residents who are
uninsured or under-insured.
Support for "Fixes" Across Party Lines
Hospitals, along with drug manufacturers and insurance companies, are viewed as a primary contributor to high health care costs. When given more than 20 options, those that Utah respondents most frequently
cited as being a “major reason” for high health care costs were:
- 77%—Drug companies charging too much money
- 72%—Hospitals charging too much money
- 66%—Insurance companies charging too much money
- 56%—Large hospitals or doctor groups using their influence to get higher payments from insurance companies
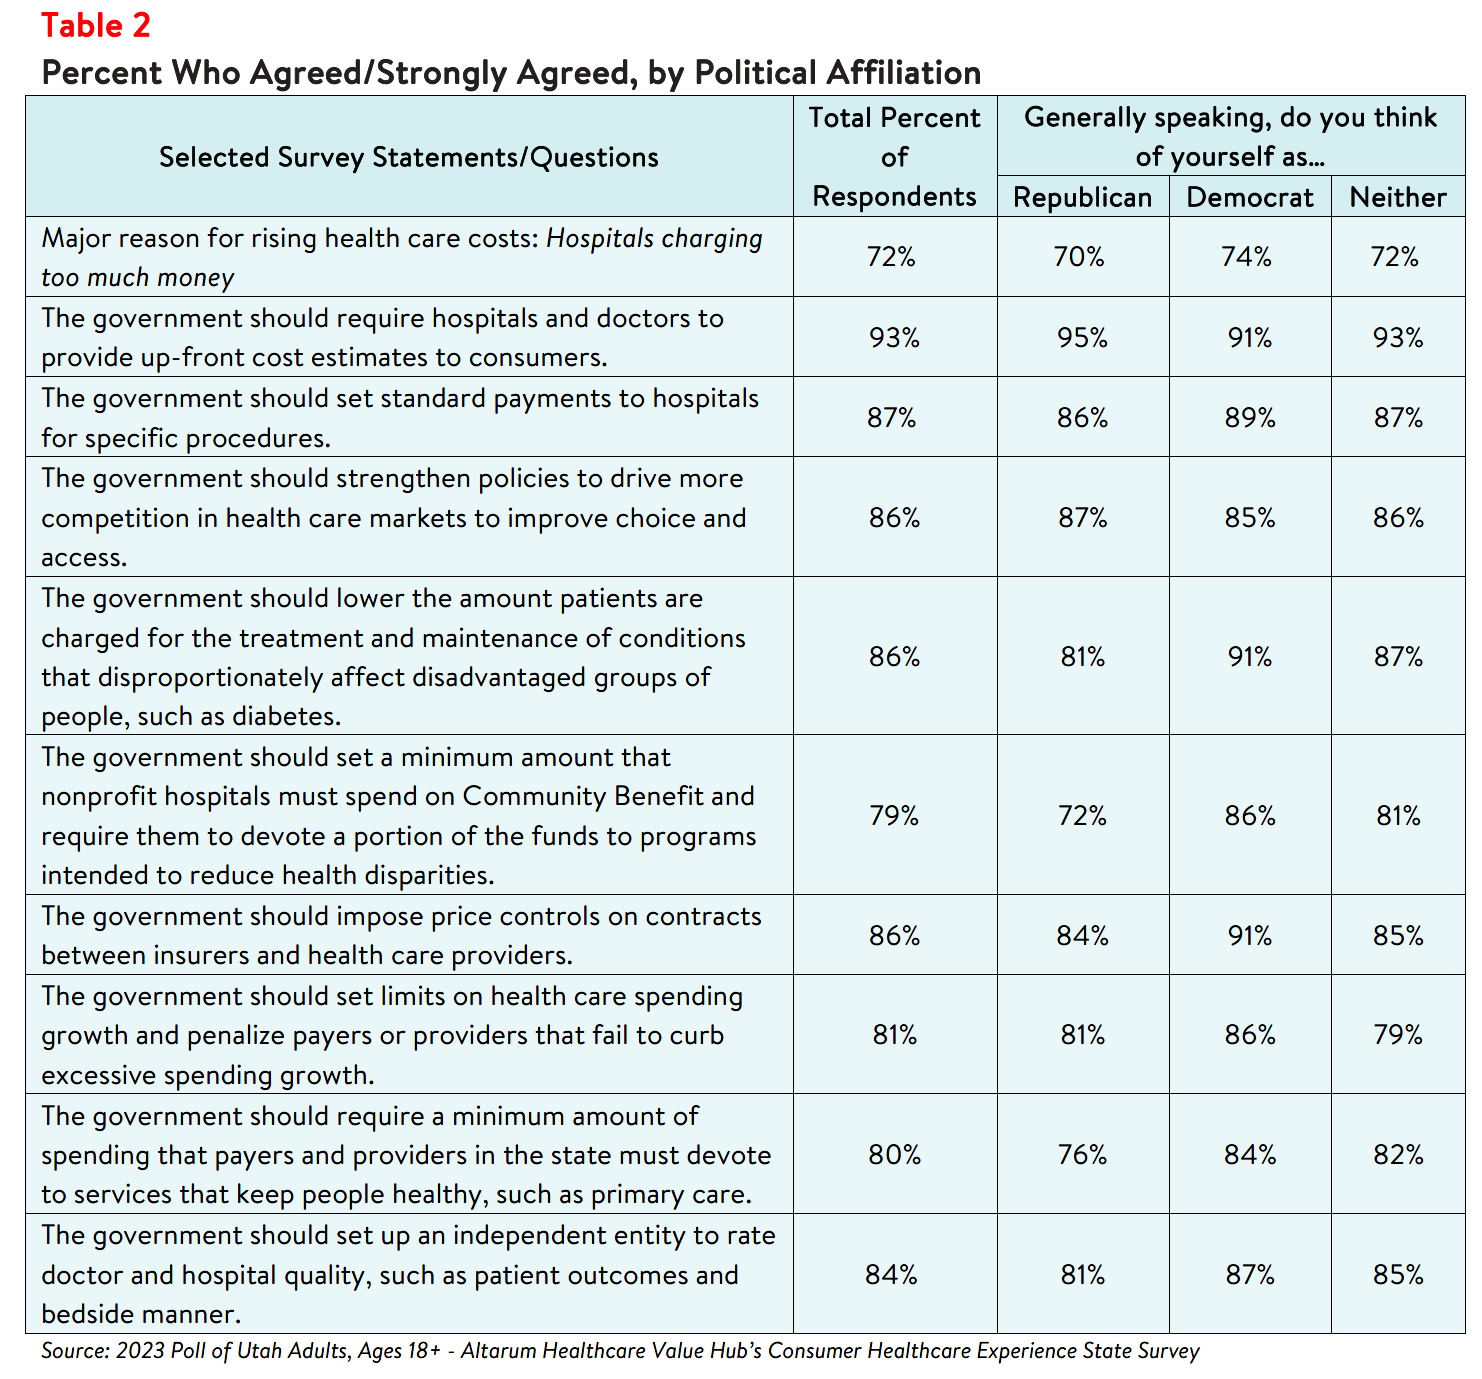
Utah respondents strongly endorse several hospital-related strategies, including:
- 93%—Require hospitals and doctors to provide up-front cost estimates to consumers
- 87%—Set standard payments to hospitals for specific procedures
- 86%—Impose price controls on contracts between insurers and health care providers
- 86%—Strengthen policies to drive more competition in health care markets to improve choice and access
- 84%—Set up an independent entity to rate doctor and hospital quality, such as patient outcomes and bedside manner.
What’s even more interesting is the level of support for some of these strategies across party lines (see
Table 2).
Conclusion
The findings from this poll suggest that Utah respondents are somewhat motivated when it comes to
searching for hospital cost and quality information to help inform purchasing decisions and plan for a
future medical expense. Still, over half did not search for this information at all, suggesting that effort to
influence consumer shopping through price transparency initiatives may not be effective for everyone.6
It is not surprising that Utah respondents express strong support for government-led solutions to make
price and quality information more readily accessible and to help consumers navigate hospital care. Many
of the solutions that respondent’s support would take the burden of research and guesswork off
consumers - such as standardizing payments for specific hospital procedures, requiring hospitals and
doctors to provide consumers cost estimates for certain procedures, and establishing an entity to conduct
independent quality reviews. Policymakers should investigate the evidence on these and other policy
options to respond to Indiana respondents’ bipartisan call for government action.
Notes
-
Centers for Medicare and Medicaid Services. (2023). Hospital Change of Ownership. Retrieved July 17,2023, from https://data.cms.gov/provider-characteristics/hospitals-and-other-facilities/hospital-change-of-ownership
-
A CHOW typically occurs when a Medicare provider has been purchased (or leased) by another organization. The CHOW results in the transfer of the old owner’s Medicare Identification Number and provider agreement (including any outstanding Medicare debt of the old owner) to the new owner. The regulatory citation for CHOWs can be found at 42 CFR § 489.18. If the purchaser (or lessee) elects not to accept a transfer of the provider agreement, then the old agreement should be terminated and the purchaser or lessee is considered a new applicant. Most changes of ownership fall into this category. (Centers for Medicare and Medicaid Services. (2023, September). Medicare Fee-For-Service Provider Enrollment – Hospital Change of Ownership: Data Guidance. Retrieved July 17, 2023, from https://data.cms.gov/sites/default/files/2023-01/Hospital_CHOW_Data_Guidance_2023.12.30.pdf)
-
National Conference of State Legislatures. (2023, February 22). Health System Consolidation. Retrieved July 17, 2023, from https://www.ncsl.org/health/health-system-consolidation
-
As of January 1, 2021, the Centers for Medicare and Medicaid Services (CMS) requires hospitals to make public a machine-readable file containing a list of standard charges for all items and services provided by the hospital, as well as a consumer-friendly display of at least 300 shoppable services that a patient can schedule in advance. See: https://www.cms.gov/hospital-price-transparency/hospitals
-
According to Health Forum, an affiliate of the American Hospital Association, hospital adjusted expenses per
inpatient day in Utah were $3,179 in 2021, which is above the national average. See: Kaiser Family
Foundation, State Health Facts Data: Hospital Adjusted Expenses per Inpatient Day. Accessed August 30,
2023. https://www.kff.org/health-costs/state-indicator/expenses-per-inpatient-day/ -
This survey was conducted after the Centers for Medicare and Medicaid Services’ rule requiring hospitals topublicly display all standard charges for all items and services, as well as shoppable services, in a consumer-friendly format went into effect. However, low compliance from large hospitals indicates that the rule has yet to demonstrate the desired effect. See: Kelly, Susan, “Hospitals Still Fall Short on Price Transparency, Consumer Group Says,” Healthcare Dive (Aug. 10, 2023). See also: Kurani, Nisha, et al., Early Results from Federal Price Transparency Rule Show Difficulty in Estimating the Cost of Care, Kaiser Family Foundation, (April 9, 2021).
Methodology
Altarum’s Consumer Healthcare Experience State Survey (CHESS) is designed to elicit respondents’ unbiased views on a wide range of health system issues, including confidence using the health system, financial burden and possible policy solutions. This survey, conducted from May 18 to June 3, 2022, used a web panel from online survey company Dynata with a demographically balanced sample of approximately 1,504 respondents who live in Utah. Information about Dynata’s recruitment and compensation methods can be found here. The survey was conducted in English or Spanish and restricted to adults ages 18 and older. Respondents who finished the survey in less than half the median time were excluded from the final sample, leaving 1,368 cases for analysis. After those exclusions, the demographic composition of respondents was as follows, although not all demographic information has complete response rates:
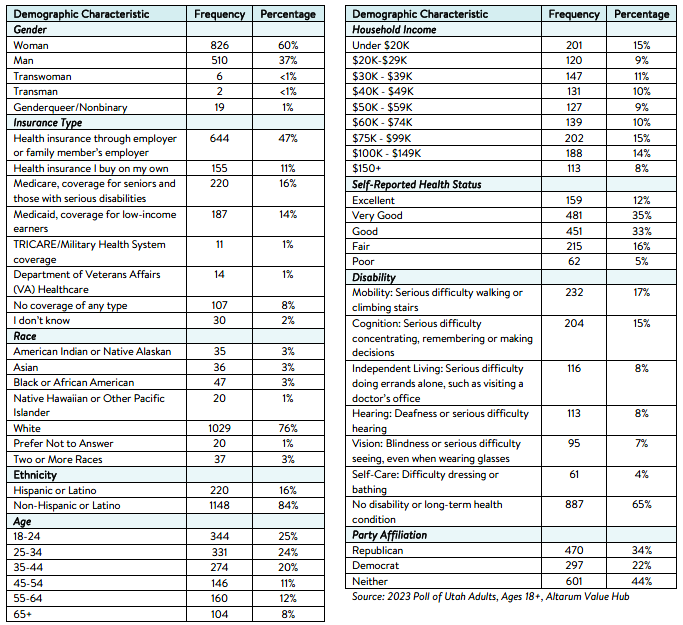
Percentages in the body of the brief are based on weighted values, while the data presented in the demographic table is unweighted. An explanation of weighted versus unweighted variables is available here. Altarum does not conduct statistical calculations on the significance of differences between groups in findings. Therefore, determinations that one group experienced a significantly different affordability burden than another should not be inferred. Rather, comparisons are for conversational purposes. The groups selected for this brief were selected by advocate partners in each state based on organizational/advocacy priorities. We do not report any estimates under N=100 and a co-efficient of variance more than 0.30.

HEALTHCARE VALUE HUB
The Healthcare Value Hub can help you find free, timely information about policies and practices to achieve health systems that are equitable, affordable, and focused on the goals and needs of the people the system is meant to serve.
Share
![]()
![]()
![]()

Follow
![]()
![]()


![]()