Many New Jersey Residents Struggle with Medical Debt, Highlighting Healthcare Affordability Issues Even for Those with Insurance
Key Findings
A survey of 963 New Jersey adults with medical debt, conducted from March 29th, 2022 to April 11 2022, found that:
- Nearly 3 in 10 respondents (29%) report owing $5,000 or more in medical debt. More than 1 in 10 (11%) report having medical debt over $10,000;
- The majority (96%) of respondents had some form of insurance coverage. Almost half (49%) of respondents who had health insurance when they incurred medical debt say it was because their plan did not cover the service, while 33% say their deductible was too high for them to meet;
- Nearly 2 in 5 respondents (36%) report that medical debt has prevented them or someone living with them from seeking care when they needed it;
- Of the 71% of respondents who report paying any amount toward their medical debt in the past year, nearly 1 in 5 (19%) report using money intended for necessities like food, heat or housing to pay that debt;
- 2 in 5 respondents (40%) report not understanding their legal rights related to medical debt collection;
- Almost half (46%) of respondents whose medical debt stemmed from a hospital report not being informed of the hospital’s financial assistance or charity care policies;
More than 3 in 4 (76%) of respondents who were sued over their medical debt tried to challenge the lawsuits against them. What’s more, the vast majority (89%) of those who tried to challenge the lawsuits against them were successful.
Health Insurance and Medical Debt
Medical debt is becoming an increasing problem for many Americans and New Jerseyans are no exception. Of the 963 New Jersey residents surveyed who have medical debt, 38% had overdue medical bills not in collections, while 30% had overdue medical bills in collections and 25% were enrolled in a payment plan to pay down their medical debt.
The most common amount of medical debt selected was $1,000-$2,499—twenty-four percent of respondents report owing that amount in medical debt. The next most frequently cited amounts were between $2,500-$4,999 (18%), $500-$999 (17%) and $5,000-$7,499 (12%). Still, more than 1 in 10 respondents (11%) report owing over $10,000 in medical debt.
Almost all (96%) of New Jersey respondents with medical debt report having health insurance and 4 in 5 (80%) report being in good, very good or excellent health. Just over half (51%) report having employer-sponsored insurance, while lower numbers are covered by Medicare (19%), insurance bought on the exchange (13%) and NJ Family Care (13%). Three in four respondents (75%) had no gaps in coverage in the past 12 months.
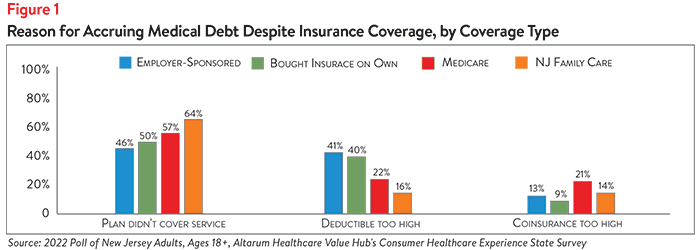
Among respondents with coverage, almost half (49%) report accruing medical debt because their insurance plan did not cover the service. One-third (33%) report accruing medical debt because their deductible was too high and they were unable to meet it, while 14% report that their coinsurance was too high (see Figure 1).
Disparities in the Amount and Reasons for Medical Debt
Medical debt affects New Jersey consumers of many races/ethnicities and along the income spectrum; however, disparities do occur.
Income
While two-thirds (67%) of respondents with household incomes of less than $50,000 per year report having $2,500 in medical debt or less, roughly 1 in 10 (9%) owe more than $10,000 in medical debt (see Figure 2). Interestingly, a higher proportion of respondents with household incomes above $100,000 per year report owing more than $10,000 in debt (15%) than respondents in any other income bracket.

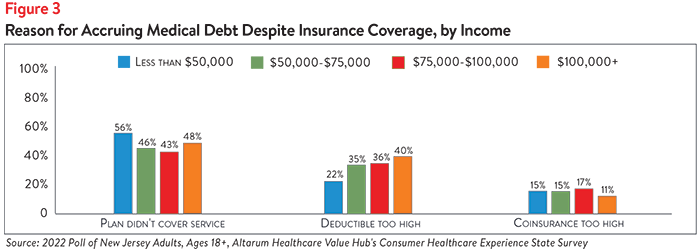
There are some differences across income brackets related to why respondents with insurance still accrued medical debt. Those earning less than $50,000 were the most likely to report that they accrued medical debt despite having health insurance because their plan did not cover the service (56%). However, very similar percentages of respondents from all other income brackets reported the same reason (see Figure 3). Those earning over $100,000 were the most likely to report that the reason they accrued debt was because their deductible was too high (40%), although similar percentages of those earning between $50,000-$75,000 (35%) and between $75,001 - $99,999 (36%) reported the same. Interestingly, almost a quarter (22%) of those earning below $50,000 reported their deductible being too high was a cause of their medical debt. High coinsurance also seemed to be a common reason for medical debt accrual across all income levels, though notably less so for those earning $100,000 or more.
Unsurprisingly, high-income earners were more likely than low-income earners to have paid down some amount of their medical debt in the past year. More than 4 in 5 (83%) of respondents earning over $100,000 report paying some amount towards their medical debt in the past 12 months, compared to 54% of those earning below $50,000.
Race/Ethnicity
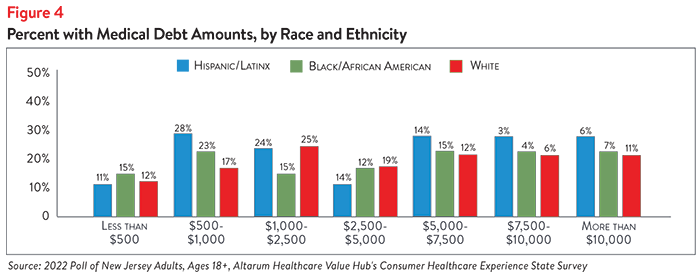
The largest differences in incidence of medical debt were seen across racial/ethnic groups. Hispanic/Latinx respondents most commonly report owing less than $2,500 in medical debt (at 63%), followed by Black/African American respondents (53%) and white respondents (52%). White respondents most commonly report having $7,500 or more in medical debt (at 17%), compared to Hispanic/Latinx respondents (9%) and Black/African American (11%) respondents (see Figure 4).
It is well-documented that white households in the U.S. tend to have more wealth than Hispanic/Latinx and Black/African American households, which may increase the ability of white respondents to take on more medical debt. Evidence also suggests that Hispanic/Latinx and Black/African American individuals are more likely to avoid care due to cost and other factors (such as trust in medical providers) than white individuals, which may impact their likelihood of accruing medical debt.1,2
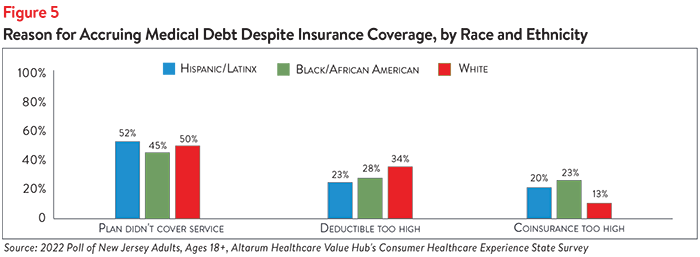
Across racial/ethnic identities, respondents with insurance report similar reasons for accruing medical debt. Roughly half of Hispanic/Latinx respondents (52%), Black/African American respondents (45%) and white respondents (50%) report accruing medical debt because their insurance plan didn’t cover the service(s) they received (see Figure 5). While white respondents were more likely than those of other races/ethnicities to report that their deductible was too high (34%), Black/African American and Hispanic/Latinx respondents were more likely to report that their coinsurance was too high, at 23% and 20%, respectively.
Medical Debt Prevents New Jerseyans from Getting Needed Care
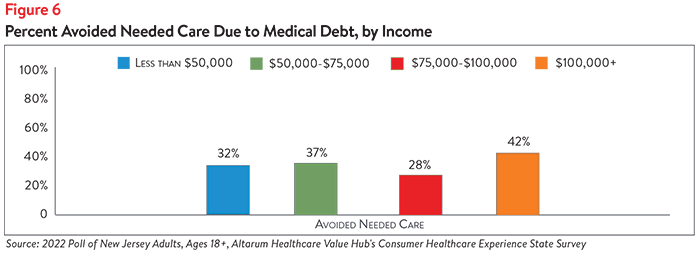
In addition to threatening New Jersey residents’ financial well-being, medical debt may negatively impact residents’ physical health by incentivizing them to ration needed care. More than 1 in 3 New Jersey respondents (36%) report that their medical debt has prevented them or someone living with them from seeking needed care. Interestingly, respondents earning over $100,000 per year were the most likely to avoid needed care due to medical debt, with 42% of respondents selecting this option (see Figure 6).
Hispanic/Latinx and Black/African American New Jersey respondents were more likely than white respondents to report that medical debt had prevented themselves or a family member from getting medical care (see Figure 7). Almost half of Hispanic/Latinx respondents (49%) report avoiding needed care as a result of medical debt, compared to 40% of Black/African American respondents and 36% of white respondents.
Medical Debt Prevents New Jerseyans from Paying Bills and Saving for the Future
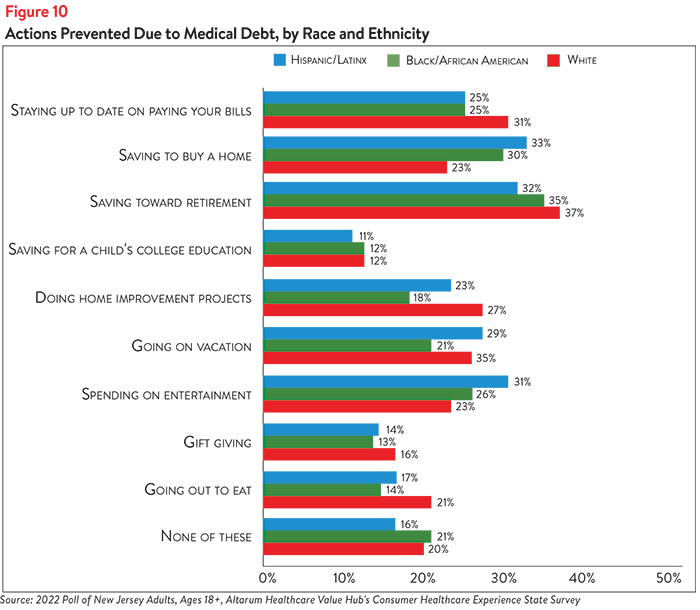
Medical debt also prevents New Jerseyans from paying bills on time and saving for the future. Nearly 3 in 10 respondents (29%) report that medical debt has prevented them from staying up-to-date on paying their bills (see Figure 8). Although this was most commonly reported by respondents earning $50,000-$75,000 per year (34%) and those earning less than $50,000 per year (29%), roughly 1 in 4 respondents in the higher-income brackets reported falling behind on bill payments as well (see Figure 9). White respondents were the most likely to report trouble staying up-to-date on bill payments due to medical debt (31%), although 25% of both Hispanic/Latinx respondents and Black/African American respondents reported the same (see Figure 10).
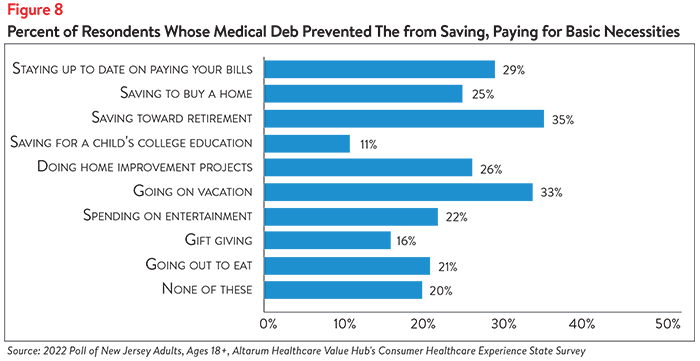
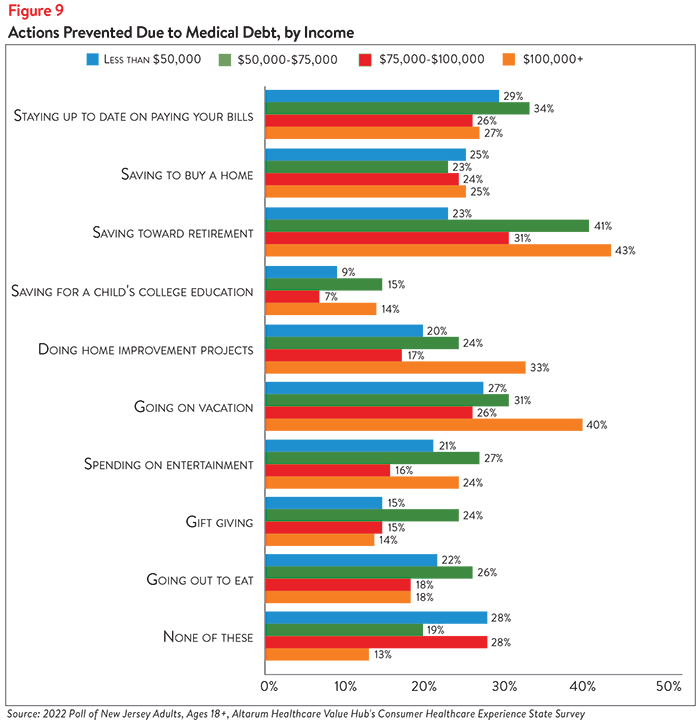
One in four respondents (25%) report that medical debt has prevented them from saving to buy a house, while greater than one-third (35%) report not being able to save for retirement (see Figure 7). Differences in ability to save for big-ticket items—such as retirement, a house or a child’s college education—were observed across income and racial/ethnic groups. Respondents earning less than $50,000 were among the least likely to report that their medical debt prevents them from saving for retirement (23%) or a child’s college education (9%), perhaps because they were already less likely than higher-income earners to do so (see Figure 9). More than 40% of respondents earning more than $100,000 per year and $50,000-$75,000 per year report not saving for retirement, while roughly 15% report not saving for a child’s college education due to medical debt. Respondents earning less than $50,000 most frequently report that medical debt prevents them from saving to buy a home (25%), although respondents across all income groups reported similar rates of avoiding this behavior.
Similar percentages of Hispanic/Latinx, Black/African American and white respondents report that medical debt prevents them from saving for retirement (32%, 35% and 37%, respectively), as well as a child’s college education (11%, 12% and 12%, respectively) (see Figure 10). However, Hispanic/Latinx respondents and Black/African American respondents were more likely than white respondents to report that their medical debt prevents them from saving to buy a house (33% and 30%, respectively, compared to 23%). This finding is particularly concerning given the historic and continuing racial and ethnic disparities in property ownership in the U.S. and the relationship between property ownership, generational wealth and the racial wealth gap.3
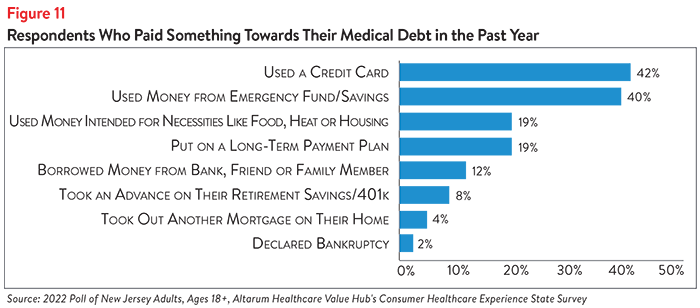
New Jersey respondents also report making difficult sacrifices to pay off their medical debt. Of the 71% of respondents who had paid at least something towards their medical debt in the past year, almost 1 in 5 (19%) report using money that was intended for necessities like food, heat or housing (see Figure 11). Two in five (40%) report using money from their emergency fund or savings and 42% used a credit card (which typically have high interest rates, making it even more difficult to pay down existing debt).
Sources of Medical Debt
3 in 5 New Jersey respondents (62%) report that their medical debt was the result of a single event. Of the options provided, the most common causes of single-incident medical debt were:
- Accident/injury (27%)
- Chronic disease treatment (23%)
- Dental, vision or hearing services (21%)
In lesser numbers, respondents report incurring medical debt from a single experience with chronic pain services (12%), mental health treatment (5%), infectious disease treatment (5%), pregnancy/birth services (4%) and prescription drug purchases (4%).
Roughly 2 in 5 respondents (38%) report that their medical debt stemmed from multiple events. When asked which services caused their multiple-incidence medical debt, the top vote getters were:
- Chronic disease treatment (34%)
- Accident/injury (28%)
- Dental, vision or hearing services (24%)
- Mental health treatment (21%)
- Chronic pain services (15%)
- Prescription drug purchases (15%)
- Infectious disease treatment (9%)
- Pregnancy/birth services (7%)
Given the high prevalence of accidents/injuries causing medical debt, it is unsurprising that New Jersey hospitals are a main site of medical debt creation. Of more than 8 options provided, respondents identified the sources of their medical debt (respondents were not limited in their site selection). Top selections were:
- Hospital (61%)
- Doctor or technician in hospital (36%)
- Doctor or technician not in hospital (23%)
- Laboratory (lab tests, x-rays, scans) (18%)
- Dentist or dental provider (17%)
In lesser numbers, people selected prescription drugs (10%), physical therapist (6%) and behavioral therapist (mental healthcare or addiction treatment) (5%) as the sites of their medical debt.
Financial Assistance and Charity Care
Despite federal and state laws requiring information on hospitals’ financial assistance programs to be widely publicized, 46% of New Jersey respondents whose medical debt stemmed from a hospital report not being informed of the hospital’s financial assistance or charity care policies (see Appendix A). Similarly, 42% of respondents with hospital-based medical debt did not apply for the hospital’s financial assistance or charity care. Just 38% of those with hospital-based medical debt who did apply for charity care or financial assistance received help.
Of particular concern is that half (49%) of respondents with no insurance coverage report not being informed of their hospital’s financial assistance or charity care policies. Given the legal obligation of nonprofit hospitals in New Jersey to inform eligible residents of the New Jersey Hospital Care Payment Assistance Program, it is concerning that uninsured patients, who are the most likely to be eligible, were unaware of their financial assistance or charity care options.
Of the respondents whose medical debt stemmed from a provider outside of a hospital, almost half (49%) report not being informed of payment assistance options available to them. Of respondents with medical debt stemming from a provider outside of a hospital, 43% did not try to negotiate their bill and 22% tried but were unsuccessful. Just 34% successfully negotiated their medical bills.
Aggressive Debt Collection Tactics
According to the Urban Institute’s Interactive Medical Debt Tool, there are different rates of medical debt in collections across different racial communities in New Jersey.4 They found that New Jersey surpasses the national average of medical debt in collections among people of color. Seventeen percent of communities of color in New Jersey have medical debt in collections, compared to 15% of communities of color nationwide. Moreover, the racial disparity in New Jersey is striking—8 percent of majority-white communities in New Jersey have medical debt in collections, compared to 17 percent of New Jersey communities of color.
Of the 48% of respondents to the Healthcare Value Hub’s survey who report having medical debt in collections, over a quarter (27%) say their bills were sent to collections within 1 month of receiving their first bill. Roughly 1 in 10 (9%) report that their bills went to collections just 1-3 weeks after they received their first bill, while nearly 1 in 5 (18%) say their bills went to collections 1 month after receiving their first bill. Nearly a third of respondents (32%) report that their bills were sent to collections 2-3 months after they received their first bill.
Moreover, many have experienced aggressive debt collection practices:
- 19% of respondents with medical bills in collections report having had their wages garnished in the past 12 months
- 17% report having assets other than wages seized due to medical debt in the past 12 months
- 16% report being sued over medical debt
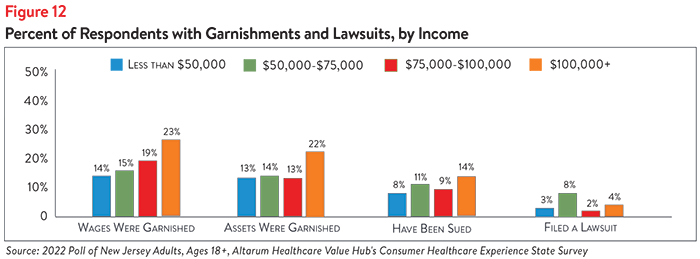
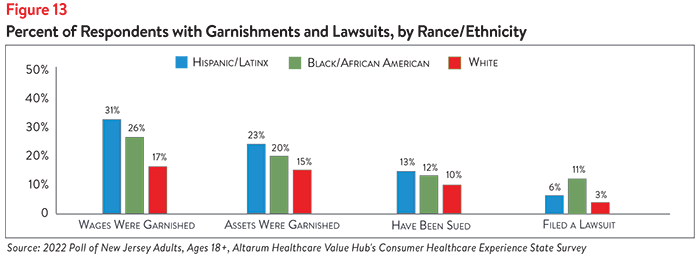
High-income earners, Hispanic/Latinx respondents and Black/African American respondents most frequently report being sued over medical debt, having their wages garnished and having their assets seized (see Figures 12 and 13). The greatest racial/ethnic disparity was observed in wage garnishment—nearly 1 in 3 (31%) of Hispanic/Latinx respondents and 1 in 4 (26%) of Black/African American respondents report having their wages garnished due to medical debt, compared to 1 in 6 (17%) of white respondents.
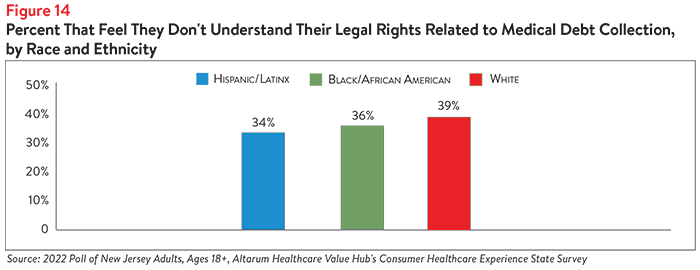
Fighting medical debt lawsuits can be difficult and time-consuming, and 2 in 5 (40%) of respondents report that they do not understand their legal rights related to medical debt collection. Indeed, just 4% of all respondents filed a lawsuit against their medical debt.
While white respondents were slightly more likely than other racial/ethnic groups to report not understanding their legal rights when it comes to medical debt collections (39%), they were least likely to report filing a lawsuit over medical debt (3%) (see Figures 13 and 14). Hispanic/Latinx and Black/African American respondents report similar levels of not understanding their medical debt (34% and 36%, respectively), however, Black/African American respondents were more likely to report challenging their medical debt in court (11%).
General lack of clarity around rights when it comes to medical debt may contribute to the low percentages of respondents who filed lawsuits to challenge their medical debt across all racial/ethnic and income groups. Still, 3 in 4 (76%) of respondents who were sued tried to challenge the lawsuits against them. What’s more, the vast majority (89%) of those who tried to challenge the lawsuits against them were successful.
Looking Ahead
Given the aggressive collection tactics and financial ramifications of medical debt, it is unsurprising that nearly 4 in 5 respondents (79%) report being somewhat or very anxious about their medical debt. Given the dire, and often inequitable, health and financial impacts of medical debt, state policymakers should investigate policies to protect residents by preventing medical debt from occurring and curbing aggressive debt collection practices. Annual surveys can help assess whether progress is being made.
For more information on healthcare affordability in New Jersey and strategies that New Jersey residents support, please see our New Jersey Consumer Healthcare Experience State Survey from 2020.
Notes
1. Kearney, Audrey, et al., Americans’ Challenges with Health Care Costs, Kaiser Family Foundation, (Dec. 14, 2021).
2. Richmond, Jennifer, What Can We Do About Medical Mistrust Harming Americans’ Health? Interdisciplinary Association for Population Health Science (Accessed June 16, 2022).
3. Ray, Rashawn, et al., Homeownership, Racial Segregation, and Policy Solutions to Racial Wealth Equity, Brookings Institute, (Sept. 1, 2021).
4. Debt in America: An Interactive Map, Share with Medical Debt in Collections—New Jersey, Urban Institute (June 23, 2022).
Methodology
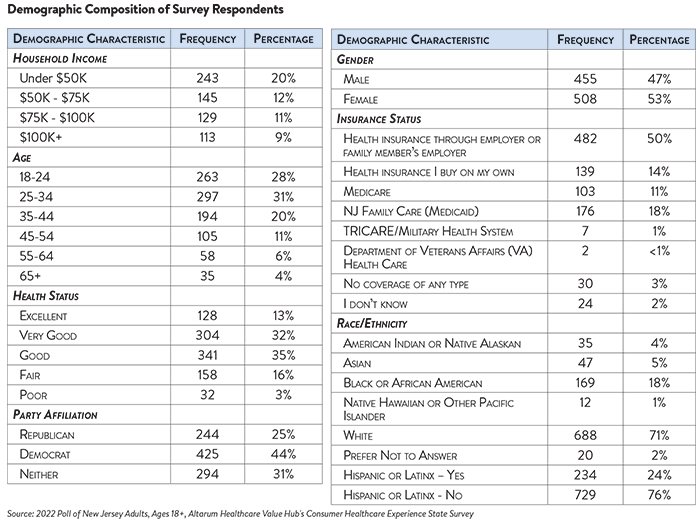
Altarum’s Medical Debt Survey is designed to elicit respondents’ unbiased views on a wide range of issues surrounding medical debt. The survey used a web panel from Dynata with a sample of approximately 1,005 respondents who live in New Jersey and currently have medical debt. The survey was conducted in English or Spanish and restricted to adults ages 18 and older. Respondents who finished the survey in less than half the median time were excluded from the final sample, leaving 963 cases for analysis. After those exclusions the demographic composition of respondents was as follows, although not all demographic information has complete response rates:
Appendix A
To help protect low-income consumers, the Affordable Care Act (ACA) requires nonprofit hospitals to provide charity care to eligible patients in order to retain their tax-exempt status.1 In addition, government hospitals are similarly required to provide charity care to financially disadvantaged patients. However, for both institutional requirements, there are no quantitative requirements for charity care. Equally importantly, hospitals are also required to widely publicize the availability of such policies.
New Jersey’s charity care regulations are more generous than those in many other states. All acute care hospitals in the state must participate in the state’s Hospital Care Payment Assistance Program (charity care), though they are not required to adopt their own financial assistance policies. To be eligible for no-cost charity care for necessary services, a person must be uninsured or have insurance that covers only part of their bill, ineligible for private or governmental coverage, and have a family income of less than or equal to 200% FPL.2
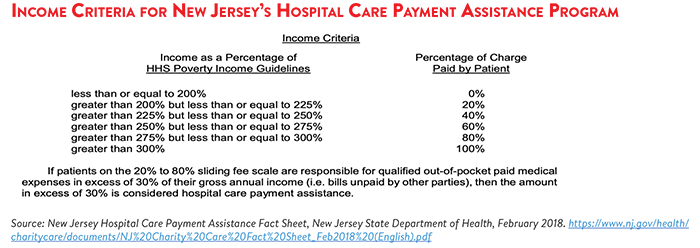
Eligible individuals with incomes between 200-300% FPL are eligible for charity care at a reduced rate, paying anywhere from 20-80% of the cost of their care.3 New Jersey also requires the Department of Health to establish a sliding scale for hospital charges for individuals whose family gross income is less than 500% FPL, though these individuals must also be uninsured.
Notes
1. Requirements for 501(c)(3) Hospitals Under the Affordable Care Act – Section 501(r), Internal Revenue Service, (Accessed June 21, 2022). https://www.irs.gov/charities-non-profits/charitable-organizations/requirements-for-501c3-hospitals-under-the-affordable-care-act-section-501r
2. New Jersey Charity Care Regulations and Public Notices, New Jersey Department of Health, (Accessed June 21, 2022). https://www.state.nj.us/health/charitycare/regs-public-notices/
3. If qualified medical expenses of individuals eligible for charity care exceed 30% of their annual gross income, the excess will be eligible for 100% coverage under charity care.

