Georgia Survey Respondents Struggle to Afford High Health Care Costs; Worry about Affording Health Care in the Future; Support Government Action Across Party Lines
Key Findings
A survey of more than 1,400 Georgia adults, conducted from July 26 to July 31, 2023, found that:
- Over 3 in 5 (67%) experienced at least one health care affordability burden in the past year;
- Over 4 in 5 (82%) worry about affording health care in the future;
- 3 in 5 (60%) of all respondents delayed or went without health care in the last year;
- Low-income respondents and those with disabilities had higher rates of going without care due to cost and incurring medical debt, depleting savings, and/or sacrificing basic needs due to medical bills; and
- Across party lines, respondents express strong support for government-led solutions.
A Range of Health Care Affordability Burdens
Like many Americans, Georgia adults experience hardship due to high health care costs. Overall, two-
thirds (67%) of respondents experienced one or more of the following health care affordability burdens in
the prior 12 months:
1) Being Uninsured Due to High Costs
Over two in five (44%) of uninsured respondents cited “too expensive” as the main reason for not having
health insurance, far exceeding other reasons like “don’t need it” and “don’t know how to get it.” In
addition, 52% of respondents without dental insurance cited cost as the main reason for not having
coverage, and 44% of those without vision insurance cited cost as the main reason for not having
coverage.
2) Delaying or Going Without Healthcare Due to Cost
Three in five (60%) of all respondents reported delaying or going without health care during the prior 12
months due to cost:
- 37%—Skipped needed dental care
- 36%—Delayed going to the doctor or having a procedure done
- 34%—Cut pills in half, skipped doses of medicine or did not fill a prescription1
- 32%—Avoided going to the doctor or having a procedure done altogether
- 32%—Skipped a recommended medical test or treatment
- 28%—Skipped needed vision services
- 21%—Had problems getting mental health care or addiction treatment
- 17%—Skipped needed hearing services
- 14%—Skipped or delayed getting a medical assistive device
Moreover, respondents who had a barrier to care, most frequently cited cost as the reason for them or
their family members not getting care in the last year (49%) followed by not being able to get an
appointment (29%), exceeding a host of other barriers like getting time off work, transportation, and lack
of childcare.
3) Struggling to Pay Medical Bills
Other times, respondents got the care they needed but struggled to pay the resulting bill. Over two in
five (45%) of respondents reported experiencing one or more of these struggles to pay their medical bills:
- 20%—Were contacted by a collection agency
- 18%—Used up all or most of their savings
- 15%—Were unable to pay for basic necessities like food, heat or housing
- 14%—Racked up large amounts of credit card debt
- 12%—Borrowed money, got a loan or another mortgage on their home
- 8%—Were placed on a long-term payment plan
Of the various types of medical bills, the ones most frequently associated with an affordability barrier
were doctor bills, dental bills, and prescription drugs. The high prevalence of affordability burdens for
these services likely reflects the frequency with which Georgia respondents seek these services. Trouble
paying for dental bills likely reflects lower rates of coverage for these services (39% said they were
partially or completely without dental coverage in the past year).
High Levels of Worry About Affording Healthcare in the Future
Georgia respondents also exhibit high levels of worry about affording health care in the future. Over four
in five (82%) reported being “worried” or “very worried” about affording some aspect of health care in the
future, including:
- 64%—Cost of nursing home or home care services
- 63%—Medical costs when elderly
- 64%—Health insurance will become unaffordable
- 61%—Medical costs in the event of a serious illness or accident
- 56%—Prescription drugs will become unaffordable
- 55%—Cost of dental care
- 50%—Cost of needed vision services
- 47%—Cost of needed hearing services
While two of the most common worries—affording the cost of nursing home or home care services and
medical costs when elderly—are applicable predominantly to an older population, they were most
frequently reported by respondents ages 25-54. This finding suggests that Georgia respondents may be
worried about affording the cost of care for both aging relatives and themselves.
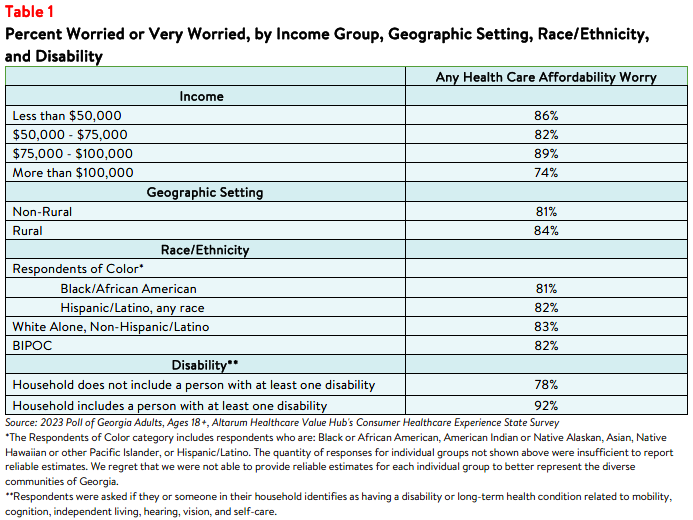
Worry about affording health care was highest among respondents living in low- and middle-income
households, and among those living in households with a person with a disability (see Table 1). Overall, 86% of respondents with household incomes less than $50,000 a year reported worrying about affording some aspect of coverage or care in the past year, as did 82% of those earning $50,000 to $75,000 per year and 89% of those earning $75,000 to $100,000 per year.2 Ninety-two percent of respondents living in a household with someone with a disability reported worry about affording health care. Still, most Georgia respondents of all incomes, races, ethnicities, geographic setting, and levels of ability were somewhat or very concerned.
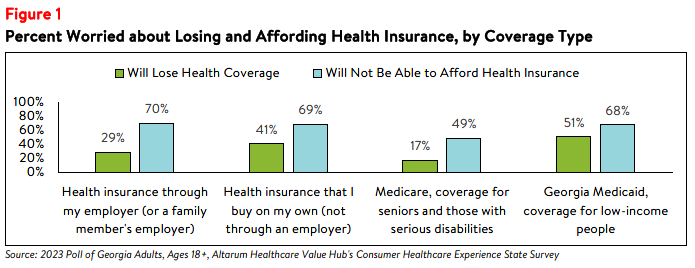
Concern that health insurance will become unaffordable is also more prevalent among certain groups of
respondents. By insurance type, respondents with coverage that they have purchased on their own, not
through an employer, most frequently reported worrying about affording coverage, followed by
respondents with coverage through their employer and those with Medicaid coverage (see Figure 1).
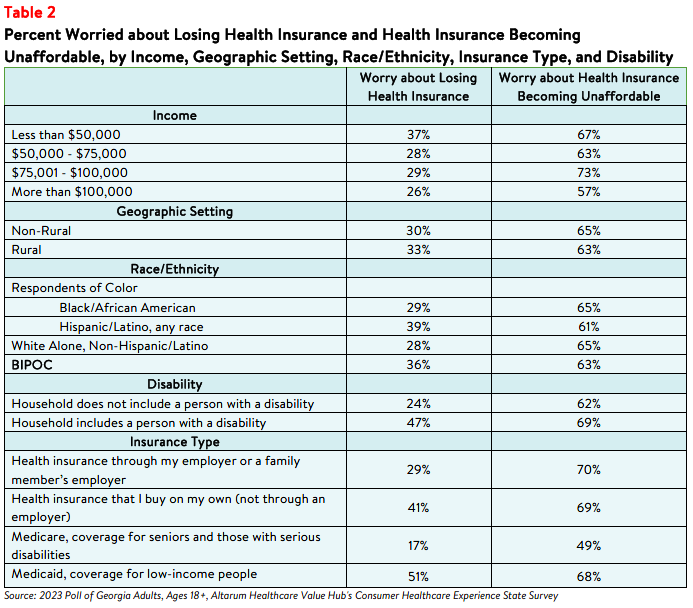
Respondents with household incomes below $50,000 per year reported the highest rates of worry about
losing coverage, while those earning $50,000 to $75,000 reported the highest rates of worry about not
being able to afford coverage in the future (see Table 2). Respondents living in households with a person
with a disability reported higher rates of being concerned about losing health insurance than those living
in a household without a person with a disability. Respondents living in rural areas reported the highest
rate of worry about affording insurance in the future compared to residents in non-rural geographic areas.
Concerns about affording coverage exceeded fears about losing coverage across all income groups,
disability statuses, geographic settings (see Appendix A), races/ethnicities, and coverage types.
Differences in Health Care Affordability Burdens
The survey also revealed differences in how Georgia respondents experience health care affordability
burdens by income, age, geographic setting, race/ethnicity, and disability.
Income and Age
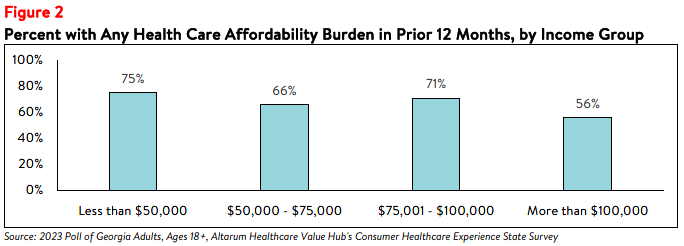
Unsurprisingly, respondents at the lowest end of the income spectrum most frequently reported
experiencing one or more health care affordability burdens, with roughly three-quarters (75%) of those
earning less than $50,000 per year reporting struggling to afford some aspect of coverage or care in the
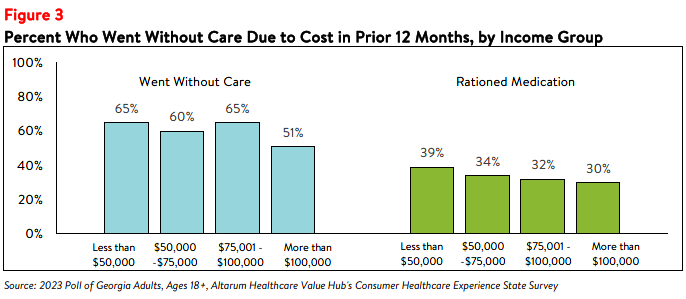
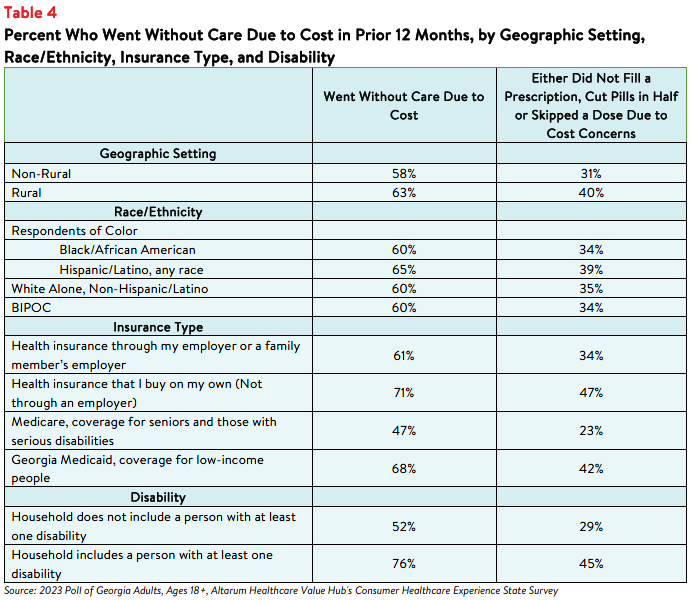
past 12 months (see Figure 2). This may be due, in part, to respondents in this income group reporting higher rates of going without care and rationing their medication due to cost (see Figure 3).
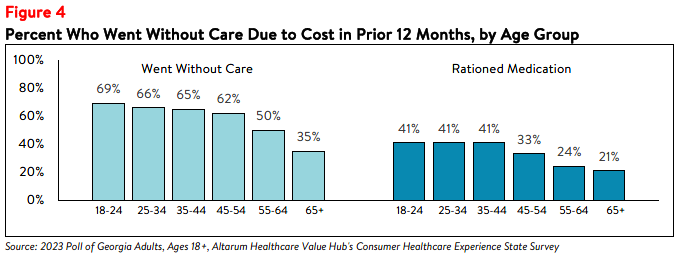
Further analysis found that Georgia respondents ages 18-54 reported higher rates of going without care
due to cost than respondents ages 55 and older (see Figure 4). Respondents ages 18-44 also most
frequently reported rationing medication due to cost compared to other age groups.
Disability
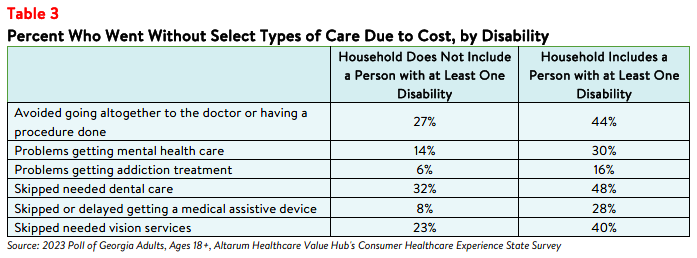
Respondents living in households with a person with a disability reported the highest rates of going
without care and rationing medication due to cost in the past 12 months. Three in four (76%) of
respondents in this group reported going without some form of care and 45% reported rationing
medication, compared to 52% and 29% of respondents living in households without a person with a
disability, respectively (see Table 4). Respondents living in households with a person with a disability also
more frequently reported delaying or skipping getting mental health care, addiction treatment, and dental
care, among other health care services, than those in households without a person with a disability due to
cost concerns (see Table 3).
Those with disabilities also face health care affordability burdens unique to their disabilities—28% of
respondents with a disabled household member reported delaying getting a medical assistive device such
as a wheelchair, cane/walker, hearing aid, or prosthetic limb due to cost. Just 8% of respondents without a
person with a disability in their household (who may have needed such tools temporarily or may not
identify as having a disability) reported this experience.
Insurance Type
Respondents who buy insurance on their own (not through an employer) reported the highest rates of
going without care due to cost and rationing medication, followed by respondents with Georgia Medicaid
coverage (see Table 4). Still, almost half (47%) of respondents with Medicare coverage also went without
care due to cost in the twelve months prior to taking the survey.
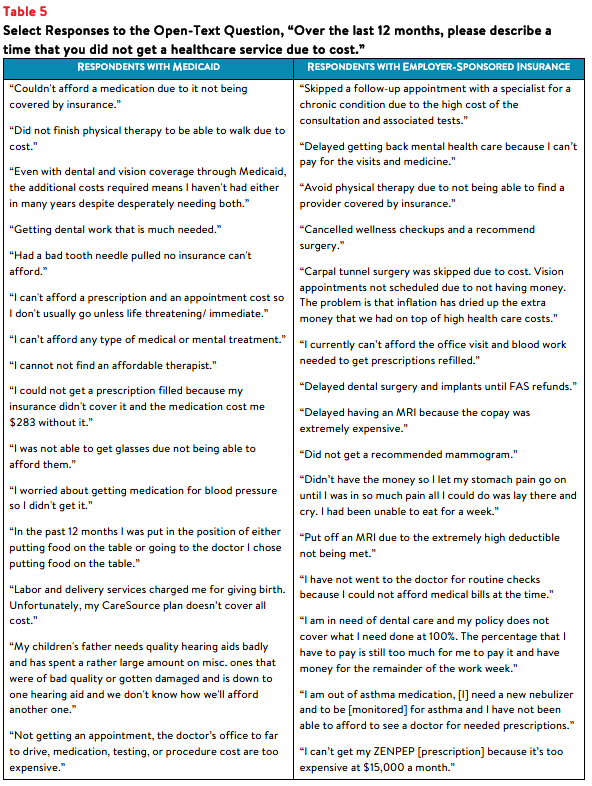
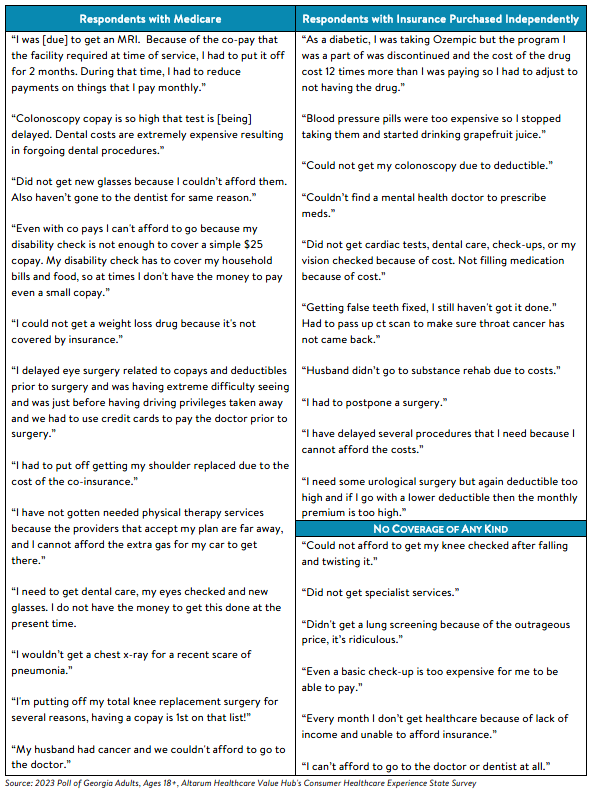
Survey respondents also had the opportunity to share their own stories about going without care due to
cost in the past year. Notably, respondents with both private insurance and Medicaid coverage reported
challenges affording care (see Table 5).
Race and Ethnicity
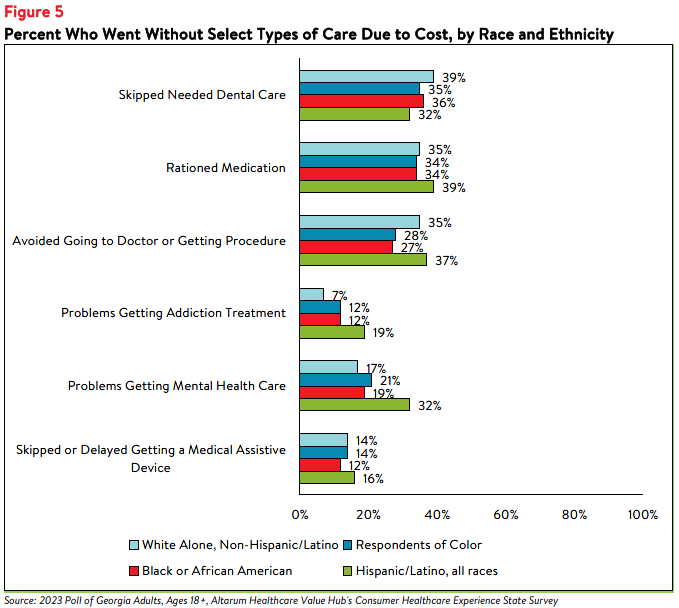
Georgia respondents who are Hispanic/Latino reported higher rates of rationing medication and forgoing
care than Black/African American and white alone, non-Hispanic/Latino respondents. Sixty-five percent
and 39% percent of Hispanic/Latino respondents reported going without care and rationing medication
due to cost, respectively, in the past twelve months (see Table 4). Further analysis showed that
Hispanic/Latino respondents also reported higher rates of challenges receiving mental health care and
avoiding going to the doctor or getting a procedure done altogether (see Figure 5).
Encountering Medical Debt
The survey also showed differences in the prevalence of financial burdens due to medical bills, including
going into medical debt, depleting savings, and being unable to pay for basic necessities (like food, heat,
and housing) by income, race, ethnicity, disability status, and geographic setting. Fifty-two percent of
Black or African American respondents and 56% of Hispanic/Latino respondents reported going into debt, depleting savings, or going without other needs due to medical bills, compared to 42% of white alone, non-Hispanic/Latino respondents (see Table 6).
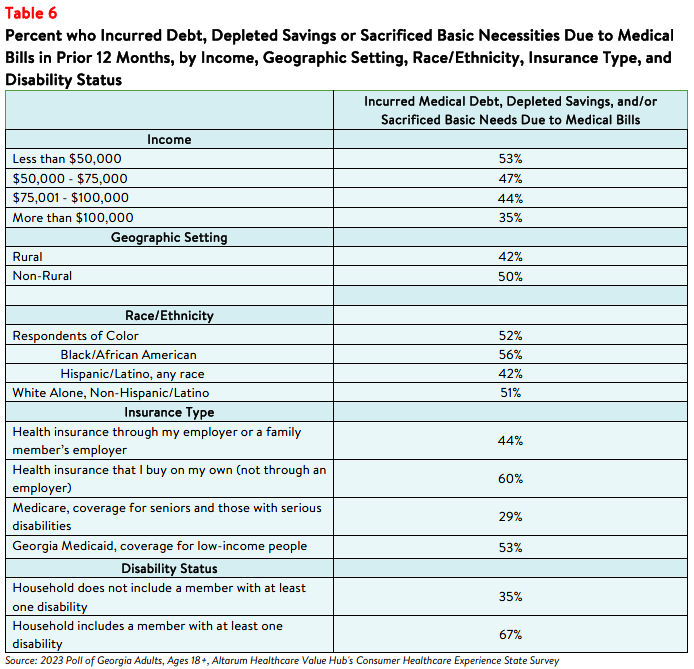
The rate of financial burden is even higher for respondents who have or live with a person with a disability,
with over two-thirds (67%) reporting going into debt or going without other needs due to medical bills,
compared to 35% of respondents without a disabled household member. Geographically, 50% of residents in rural Georgia reported going into debt or going without other needs due to medical bills, compared to 42% in non-rural regions. In addition, respondents who buy insurance on their own reported the highest rate of the above financial burdens due to medical bills (60%) compared to respondents with all other insurance types.
Impact and Worry Related to Hospital Consolidation*
In addition to the above healthcare affordability burdens, a small share of Georgia respondents were
negatively impacted by health system consolidation. From 2016 to 2021, there were 23 changes in
ownership involving hospitals through mergers, acquisitions, or changes of ownership (CHOW) in
Georgia.3,4 Georgia requires notice of nonprofit health care entity transactions and reviews the
transactions based on cost, affordability, or access criteria, but does not have the power to approve or
deny the transaction.5
In the past year, 29% of all respondents reported that they or a family member were unable to access
their preferred health care organization because of a merger that made their preferred organization out-
of-network. Out of those who reported being unable to access their preferred healthcare provider due to
a merger:
- 46% skipped recommended follow-up visits due to a merger,
- 45% delayed or avoided going to the doctor or having a procedure done because they could no longer access their preferred health care organization due to a merger,
- 33% changed their preferred doctor or hospital because they could no longer access their preferred health care organization due to a merger,
- 26% skipped filling a prescription medication due to a merger.
Out of those who reported that the merger caused an additional burden for them or their families, the top
three most frequently reported issues were:
- 39%—The merger created an added financial burden
- 24%—The merger created an added wait time when searching for a new provider
- 17%—The merger created a gap in my continuity of care (my former provider knew me and now I have to explain everything)
*Note: The sample size of respondents who said they were affected by a merger was not large enough to report reliable estimates, so the values in this section should be interpreted with caution.
While a small portion of respondents reported being unable to access their preferred health care
organization because of a merger, far more respondents (58%) reported somewhat, moderately or very
worried about the impacts of mergers in their health care organizations. When asked about their largest
concern respondents most frequently reported:
- 23%—I’m concerned I will have fewer choices of where to receive care
- 25%—I’m concerned my doctor may no longer be covered by my insurance
- 27%—I’m concerned I will have to pay more to see my doctor
- 12%—I’m concerned I will have to travel farther to see my doctor
- 13%—I’m concerned I will have a lower quality of care
Dissatisfaction with the Health System and Support for Change
In light of Georgia respondents’ health care affordability burdens and concerns, it is not surprising that
they are dissatisfied with the health system:
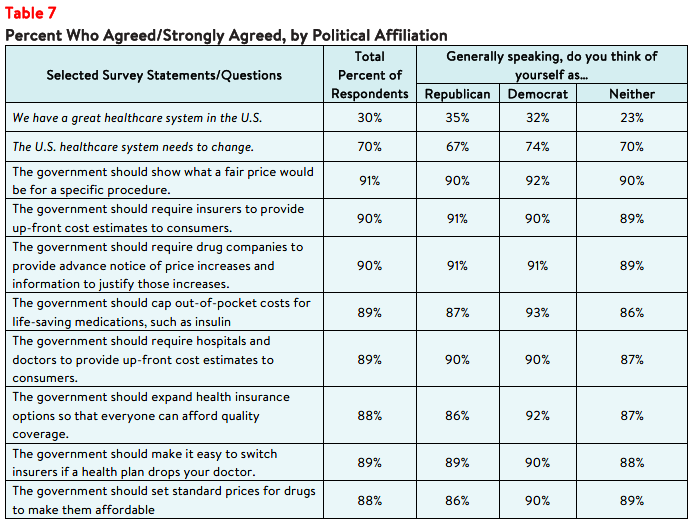
- Just 30% agreed or strongly agreed that “we have a great healthcare system in the U.S.,”
- While 70% agreed or strongly agreed that “the system needs to change."
To investigate further, the survey asked about both personal and governmental actions to address health
system problems.
Personal Actions
Georgia respondents see a role for themselves in addressing health care affordability. When asked about
specific actions they could take:
- 61% of respondents reported researching the cost of a drug beforehand, and
- 73% said they would be willing to switch from a brand name to an equivalent generic drug if given the chance.
When asked to select the top three personal actions they felt would be most effective in
addressing health care affordability (out of ten options), the most common responses were:
- 70%—Take better care of my personal health
- 45%—Research treatments myself before going to the doctor
- 36%—Do more to compare doctors on cost and quality before getting services
- 22%—Write to or call my state representative asking them to take action on high healthcare prices and lack of affordable coverage options
- 23%—There is not anything I can do personally to make our health system better
Government Actions
But far and away, Georgia respondents see government as the key stakeholder that needs to act to
address health system problems. Moreover, addressing health care problems is one of the top priorities
that respondents want their elected officials to work on.
At the beginning of the survey, respondents were asked what issues the government should address in the upcoming year. The top vote getters were:
- 50%—Economy/Joblessness
- 45%—Health care
- 33%—Taxes
When asked about the top three health care priorities the government should work on, the top vote getters were:
- 50%—Address high health care costs, including prescription drugs
- 32%—Get health insurance to those who cannot afford coverage
- 33%—Improve Medicare, coverage for seniors and those with serious disabilities
- 35%—Preserve consumer protections preventing people from being denied coverage or charged more for having a pre-existing medical condition
Of more than 20 options, Georgia respondents believe the reason for high health care costs is unfair
prices charged by powerful industry stakeholders:
- 69%—Drug companies charging too much money
- 69%—Hospitals charging too much money
- 67%—Insurance companies charging too much money
When it comes to tackling costs, respondents endorsed a number of strategies, including:
- 91%—Show what a fair price would be for specific procedures
- 90%—Require insurers to provide up-front cost estimates to consumers
- 89%—Cap out-of-pocket costs for life-saving medications, such as insulin
- 90%—Require drug companies to provide advanced notice of price increases and information to justify those increases
- 89%—Require hospitals and doctors to provide up-front cost estimates to consumers
- 88%—Expand health insurance options so that everyone can afford quality coverage
- 89%—Make it easy to switch insurers if a health plan drops your doctor
- 88%—Set standard prices for drugs to make them affordable
- 86%—Set standard payments to hospitals for specific procedures
- 88%— Authorize the Attorney General to take legal action to prevent price gouging or unfair prescription drug price hikes
Support for Action Across Party Lines
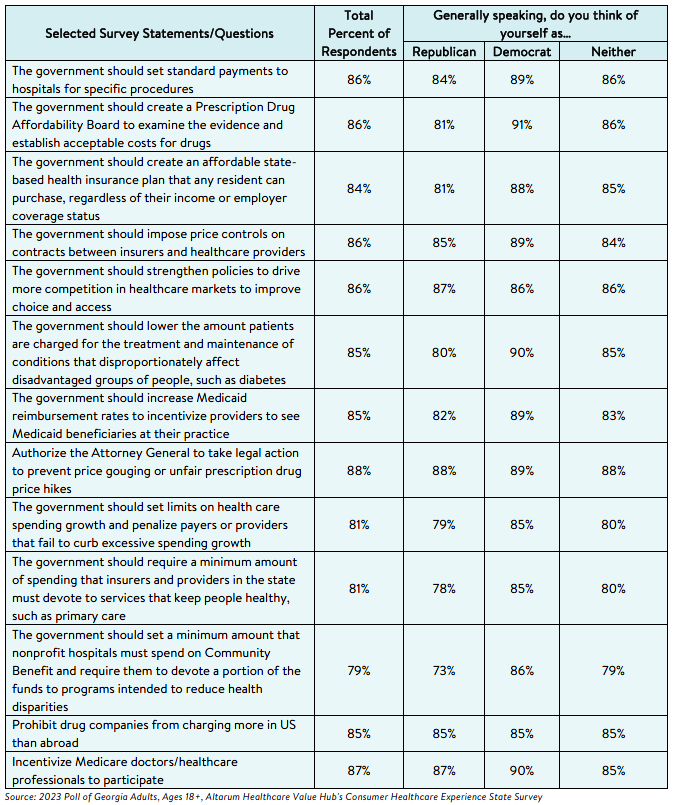
There is also remarkable support for change regardless of respondents' political affiliation (see Table 7).
The high burden of health care affordability, along with high levels of support for change, suggest that
elected leaders and other stakeholders need to make addressing this consumer burden a top priority.
Moreover, the COVID crisis has led state residents to take a hard look at how well health systems are
working for them, with strong support for a wide variety of actions. Annual surveys can help
assess whether progress is being made.
Notes
- Twenty-one percent (26%) did not fill a prescription and 22% cut pills in half or skipped doses of medicine due to cost.
- Median household income in Georgia was $65,030 (2017-2021). U.S. Census, Quick Facts. Retrieved from: U.S. Census Bureau QuickFacts, https://www.census.gov/quickfacts/fact/.
- Centers for Medicare and Medicaid Services. (2023). Hospital Change of Ownership. Retrieved September 11, 2023, from https://data.cms.gov/provider-characteristics/hospitals-and-other-facilities/hospital-change-of-ownership.
- A CHOW typically occurs when a Medicare provider has been purchased (or leased) by another organization. The CHOW results in the transfer of the old owner's identification number and provider agreement (including any Medicare outstanding debt of the old owner) to the new owner…An acquisition/merger occurs when a currently enrolled Medicare provider is purchasing or has been purchased by another enrolled provider. Only the purchaser's CMS Certification Number (CCN) and tax identification number remain. Acquisitions/mergers are different from CHOWs. In the case of an acquisition/merger, the seller/former owner's CCN dissolves. In a CHOW, the seller/former owner's CCN typically remains intact and is transferred to the new owner. A consolidation occurs when two or more enrolled Medicare providers consolidate to form a new business entity. Consolidations are different from acquisitions/mergers. In an acquisition/merger, two entities combine but the CCN and tax identification number (TIN) of the purchasing entity remains intact. In a consolidation, the TINs and CCN of the consolidating entities dissolve and a new TIN and CCN are assigned to the new, consolidated entity. Source: Missouri Department of Health and Senior Services, Change of Ownership Guidelines—Medicare/State Certified Hospice. Retrieved August 23, 2023, from
https://health.mo.gov/safety/homecare/pdf/CHOW-Guidelines-
StateLicensedHospice.pdf#:~:text=Acquisitions%2Fmergers%20are %20different%20from%20CHOWs.%20In%20the%2
0case,providers%20consolidate%20to%20form%20a%20new%20business%20entity. - The Source on Healthcare Price and Competition, Merger Review, Retrieved September 11, 2023 from
https://sourceonhealthcare.org/market-consolidation/merger-review/
Methodology
Altarum’s Consumer Healthcare Experience State Survey (CHESS) is designed to elicit respondents’ unbiased views on a wide range of health system issues, including confidence using the health system, financial burden and possible policy solutions.
This survey, conducted from July 26 to July 31, 2023, used a web panel from online survey company Dynata with a demographically balanced sample of approximately 1,500 respondents who live in Georgia. Information about Dynata’s recruitment and compensation methods can be found here. The survey was conducted in English or Spanish and restricted to adults ages 18 and older. Respondents who finished the survey in less than half the median time were excluded from the final sample, leaving 1,473 cases for analysis. After those exclusions, the demographic composition of respondents was as follows, although not all demographic information has complete response rates:
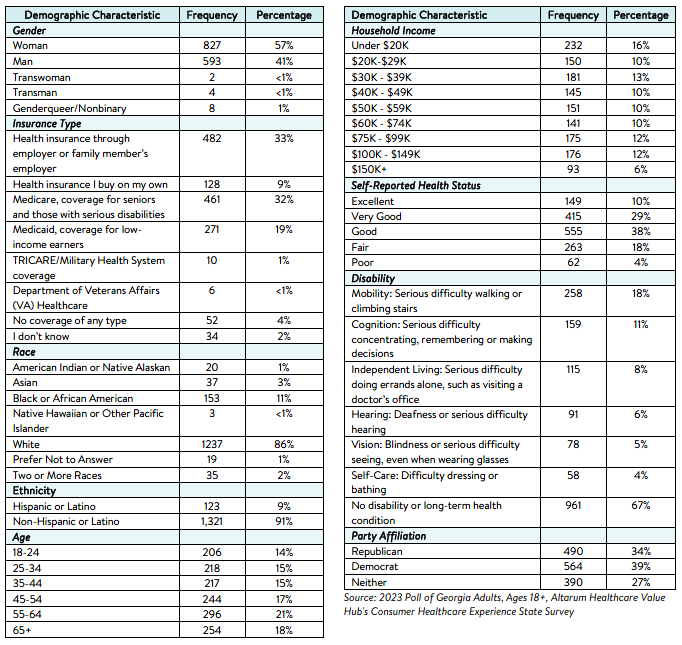
Percentages in the body of the brief are based on weighted values, while the data presented in the demographic table is unweighted. An explanation of weighted versus unweighted variables is available here. Altarum does not conduct statistical calculations on the significance of differences between groups in findings. Therefore, determinations that one group experienced a significantly different affordability burden than another should not be inferred. Rather, comparisons are for conversational purposes. The groups selected for this brief were selected by advocate partners in each state based on organizational/advocacy priorities. We do not report any estimates under N=100 and a co-efficient of variancemore than 0.30.
Appendix A
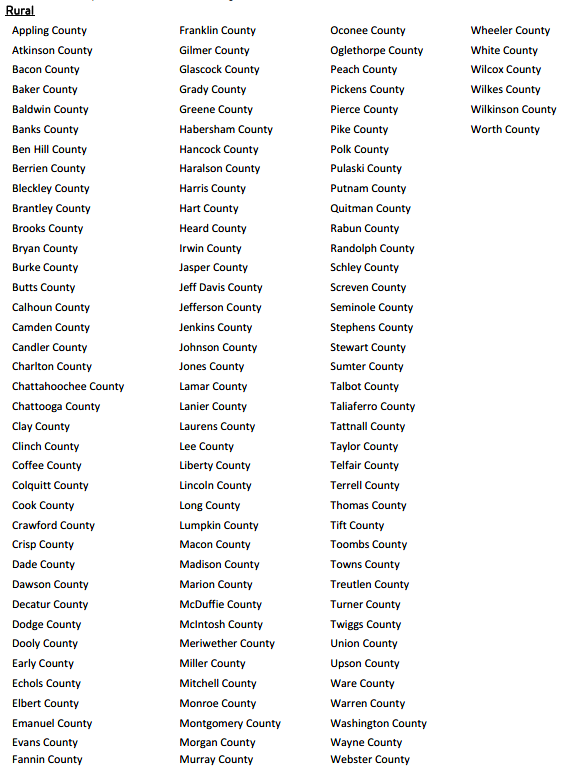
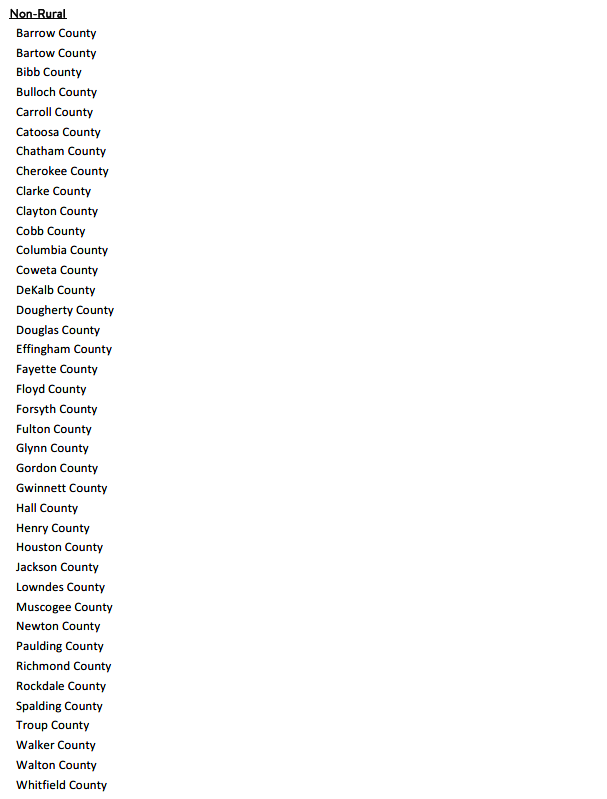
Georgia counties were divided geographically into rural or non-rural regions. Rural counties have a population that is <50,000 residents, or based on the military installation exclusion clause – § 31-7-94.1(c)(2).

Georgia Survey Results
Statewide Reports
Prescription Drug Affordability
Regional Reports
East
Metro Atlanta
North
Southwest
Report Download
|
HEALTHCARE VALUE HUB
The Healthcare Value Hub can help you find free, timely information about policies and practices to achieve health systems that are equitable, affordable, and focused on the goals and needs of the people the system is meant to serve.
Share
![]()
![]()
![]()

Follow
![]()
![]()


![]()