Ohio Residents Struggle to Afford High Healthcare Costs; Support a Range of Government Solutions Across Party Lines
Nationally, consumer worry about healthcare affordability has been well documented, but now—for the first time—a new survey looks specifically at how affordability concerns and ideas for action play out in Ohio.
A Range of Healthcare Affordability Burdens
Like many Americans, Ohio residents currently experience hardship due to high healthcare costs. All told, 53% of Ohio adults experienced one or more of the following healthcare affordability burdens in the prior 12 months:
1) Being Uninsured Due to High Premium Costs
- 47% of uninsured adults cited “too expensive” as the major reason for not having coverage, far exceeding other reasons like “don’t need it” and “don’t know how to get it.”
2) Delaying or Forgoing Healthcare Due to Cost
Two out of five (43%) Ohio adults who needed healthcare during the year encountered one or more cost related barriers to getting that care. In descending order of frequency, they reported:
- 30%—Delayed going to the doctor or having a procedure done
- 27%—Avoided going to the doctor or having a procedure done altogether
- 24%—Skipped a recommended medical test or treatment
- 20%—Did not fill a prescription
- 16%—Cut pills in half or skipped doses of medicine
- 13%—Had problems accessing mental healthcare
Moreover, cost was by far the most frequently cited reason for not getting needed medical care, exceeding a host of other possible barriers like transportation, difficulty getting an appointment, and lack of childcare.
Of the various types of medical bills, the ones most frequently associated with an affordability barrier were doctor bills, dental bills and prescription drugs, likely reflecting the frequency with which Ohio adults seek these services—or, in the case of dental, perhaps lower rates of coverage for these services.
3) Struggling to Pay Medical Bills
In some cases, Ohioans got the care they needed but struggled to pay the resulting bill. More than one-third (35%) of Ohio adults experienced one or more of these struggles to pay their medical bills:
- 15%—Contacted by a collection agency
- 11%—Used up all or most of their savings
- 10%—Unable to pay for basic necessities like food, heat, or housing
- 9%—Placed on a long-term payment plan
- 8%—Racked up large amounts of credit card debt
- 8%—Borrowed money, got a loan or another mortgage on home
High Levels of Worry About Affording Healthcare in the Future
In even greater numbers, Ohio adults worry about affording healthcare in the future. Overall, three out of four (78%) reported being “worried” or “very worried” about affording some aspect of healthcare in the future, including:
- 63%—Cost of nursing home and home care services
- 63%—Medical costs when elderly
- 62%—Cost of a serious illness or accident
- 54%—Cost of prescription drugs
In addition, more than half (60%) of respondents were “worried” or “very worried” about not being able to afford health insurance in the future. The greatest concern was among those that buy private health coverage or have Medicaid—about three quarters of those adults were worried (see Figure 1). Moreover, many are worried about losing their coverage, with Medicaid recipients being the most worried.
![DB No. 49 - Ohio Healthcare Affordability Figure 1[1].png](/application/files/8315/6752/7810/DB_No._49_-_Ohio_Healthcare_Affordability_Figure_11.png)
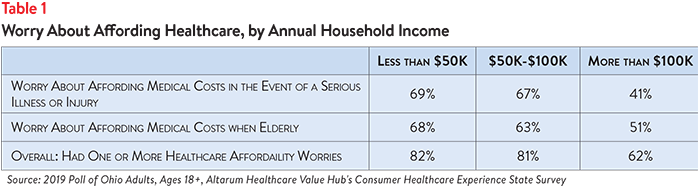
Healthcare Affordability Concerns by Income
Worries about affording healthcare go far up the income ladder. While lower-income households (less than $50K/year) have the highest levels of worry, more than half of high-income households (more than $100K/year) have healthcare affordability worries (see Table 1).
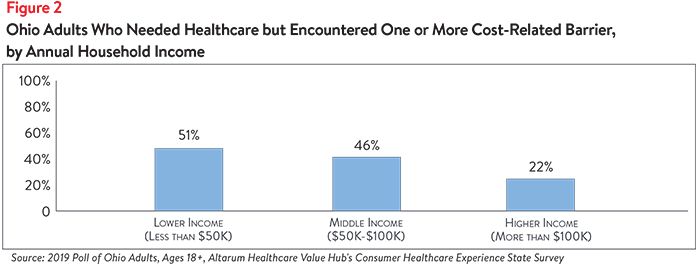
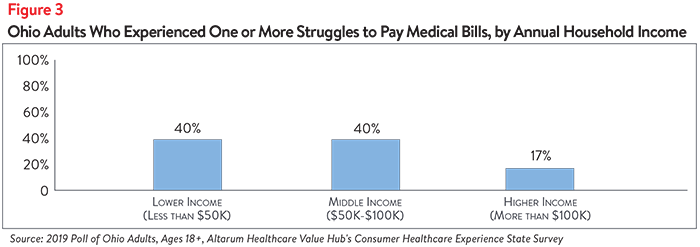
Lower-income households (less than $50K/year) reported the greatest healthcare burdens during the past 12 months but these burdens remain high for the middle income group: avoiding needed care and/or struggling to pay their medical bills (See Figures 2 and 3).
Dissatisfaction with the Health System and Support for Change
In light of these healthcare affordability concerns, it is not surprising that Ohio residents were extremely dissatisfied with the health system. Statewide:
- Just 26% agreed or strongly agreed with the statement “We have a great healthcare system in the U.S.,”
- While 75% agreed or strongly agreed “the system needs to change.”
The survey asked about both personal and governmental actions to address healthcare system problems.
Personal Actions
Ohioans see a role for themselves in addressing healthcare affordability. When asked to rank the three personal actions that would be most effective in addressing the affordability of healthcare (out of ten options), top vote getters were:
- 63%—Taking better care of their personal health
- 41%—Write or call my STATE representative asking them to take action
- 36%—Write or call my FEDERAL representative asking them to take action
- 35%—Research treatments myself, before going to the doctor
Respondents also reported specific actions they have already taken, like researching the cost of a drug beforehand (58%), as well as action they are willing to take, such as switching from a brand to a generic when that is an option (81%).
Government Actions
But far and away, Ohio residents see government as the key stakeholder that needs to act to address health system problems. Moreover, addressing healthcare problems trumps other issues that Ohioans want their elected representatives to work on.
At the beginning of the survey, respondents were asked what issues the government should address in the upcoming year. Healthcare was the most frequently cited issue, far exceeding the other eight options. The top vote getters were:
- 69%—Healthcare
- 43%—Economy/Joblessness
- 40%—Taxes
When asked about the top three healthcare priorities the government should work on, top vote getters were:
- 53%—addressing high healthcare costs, including prescription drugs
- 37%—preserving consumer protections like: you can’t be denied coverage or charged more if you have a pre-existing medical condition
- 35%—getting health insurance to those who cannot afford coverage
Of more than 20 options, those cited most frequently as being a “major reason” for high healthcare costs were:
- 75%—Drug companies charging too much money
- 65%—Hospitals charging too much money
- 62%—Insurance companies charging too much money
- 50%—Some well-known or large hospitals or doctor groups using their influence to get higher payments from insurance companies
When it comes to tackling costs and other consumer problems, respondents endorsed a number of strategies:
- 91%—Make it easy to switch insurers if a health plan drops your doctor
- 91%—Show what a fair price would be for specific procedures
- 91%—Require insurers to provide upfront cost estimates to consumers
- 90%—Authorize the Attorney General to take legal action to prevent price gouging or unfair prescription drug price hikes
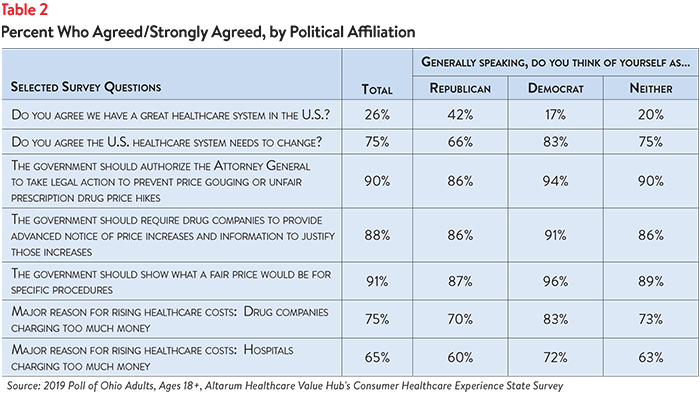
What is remarkable about the findings is high support for change regardless of the respondent’s political affiliation (Table 2).
The high burden of healthcare affordability along with high levels of support for change suggest that elected leaders and other stakeholders need to make addressing this consumer burden a top priority. Annual surveys can help assess whether or not progress is being made in the eyes of the consumers.
Methodology
Altarum’s Consumer Healthcare Experience State Survey (CHESS) is designed to elicit respondents’ unbiased views on a wide range of health system issues, including confidence using the health system, financial burden, and views on fixes that might be needed.
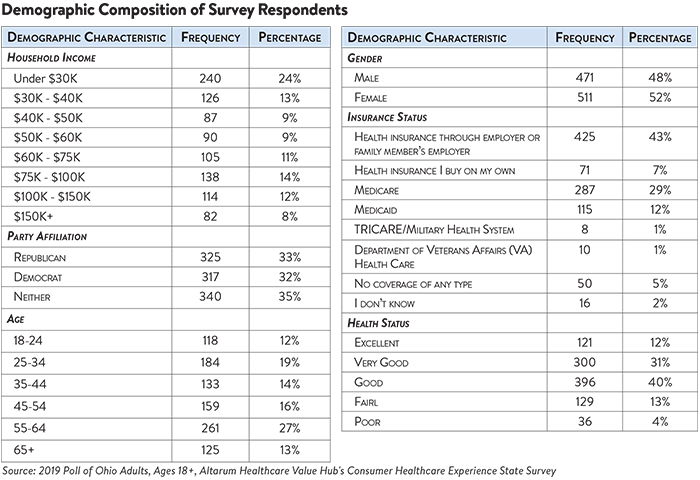
The survey used a web panel from SSI Research Now containing a demographically balanced sample of approximately 1,000 respondents who live in Ohio. The survey was conducted from March 21 - March 28, 2019 only in English and restricted to adults ages 18 and older. Respondents who finished the survey in less than half the median time were excluded from the final sample, leaving 982 cases for analysis with sample balancing occurring in age, gender and income to be demographically representative of Ohio. After those exclusions, the demographic composition of respondents is as follows.

HEALTHCARE VALUE HUB
The Healthcare Value Hub can help you find free, timely information about policies and practices to achieve health systems that are equitable, affordable, and focused on the goals and needs of the people the system is meant to serve.
Share
![]()
![]()
![]()

Follow
![]()
![]()


![]()