Excess Administrative Spending in Healthcare: Significant Savings Possible
Administrative spending refers to the costs incurred by insurers, hospitals, doctors’ offices and other entities to conduct the business side of healthcare. These costs reflect billing and insurance related activities (BIR), enrollment and member administration, marketing costs, provider and medical management, corporate services and other non-clinical functions.
Some administrative spending is valuable to the operation of the health system. Consequently, we define administrative waste as any administrative spending that exceeds that necessary to achieve the overall goals of the organization or the system as a whole.1 The National Academy of Medicine’s seminal 2010 work, The Healthcare Imperative: Lowering Costs and Improving Outcomes, identified unnecessary administrative costs as one of six key areas that need to be addressed to bring greater value and lower costs to healthcare consumers.2 Administrative costs have been estimated to represent 25 to 31 percent of total healthcare expenditures in the United States, a proportion twice that found in Canada and significantly greater than in all other Organization for Economic Cooperation and Development member nations for which such costs have been studied.3 Moreover, the rate of growth in administrative costs in the U.S. has outpaced that of overall healthcare expenditures and is projected to continue to increase without reforms to reduce administrative complexity.4
Current data collection approaches make it difficult for policymakers to grasp the total magnitude of administrative healthcare spending in the U.S. and even more difficult to identify when administrative spending is wasteful. Yet, the evidence discussed below suggests that these administrative costs can be trimmed, providing cost savings to the U.S. healthcare system.
What is Included in Administrative Spending?
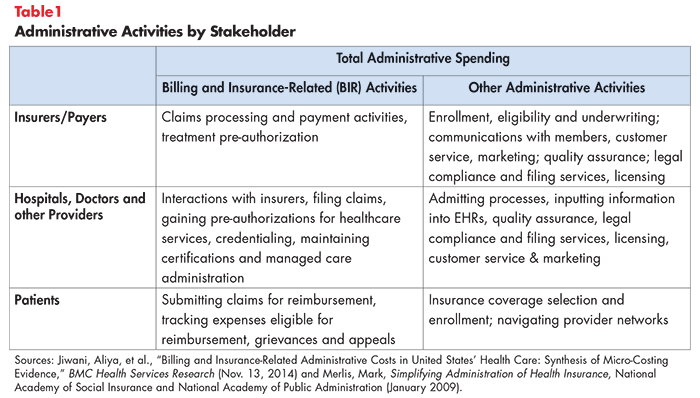
Understanding the full scope of administrative spending means considering the various healthcare stakeholders and types of expenses that each stakeholder incurs. Stakeholders ranging from insurers and payers, to hospital and other providers and patients are incurring administrative expenses (see Table 1).
There are no hard and fast rules for what should be included in estimates of administrative spending. As an example, profits and surplus are an important component of the non-clinical spending sometimes included with administrative spending but are excluded from this analysis. Moreover, many analyses of administrative spending are restricted to billing and insurance related (BIR) expenses, so Table 1 also breaks administrative activities into BIR and non-BIR categories. The primary purpose of BIR activities is to move money from payer to provider in accordance with agreed-upon rules.5
Administrative Cost by Type of Payer
The administrative costs associated with large groups are lower (as a percent of total revenues) than the costs incurred by payers covering small groups of enrollees. Large groups enjoy economies of scale and can spread fixed administrative costs over more enrollees. In contrast, administrative costs are higher for small groups due to the added marketing costs and volatility of the enrollee risk pool.6
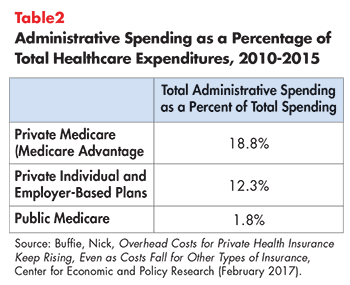
Private payers have higher administrative spending than public payers, with the former spending more on marketing and having greater variation in the rules for reimbursement compared to public payers (see Table 2).7 In contrast, public payers like Medicare are not subject to certain administrative expenses like state taxes, licenses and fees or capital requirements. Moreover, enrollment and billing are handled by the Social Security Administration and are not reflected as costs related to Medicare.8 Nonetheless, private insurance administration is frequently cited as ripe for potential saving.9
Where is the Excess?
Administrative waste cannot be measured directly, yet comparative data suggests that there is waste to be trimmed.10
Billing and Insurance Related Activities (BIR)
A key segment of wasteful administrative spending is found in the significant amount of paperwork needed in our multi-payer healthcare financing system. Having myriad payers, each with different payment and certification rules, increases the complexity and duplication of tasks related to billing and reimbursement activities. Hence, the total BIR component of administrative spending—representing about 18 percent of total healthcare expenditures11—is often singled out as wasteful and a potential source of savings. An often-cited statistic is that hospitals generally have more billing specialists than beds.12
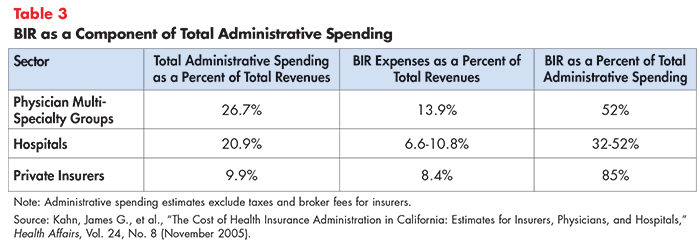
Detailed data on the components of administrative spending are hard to come by, particularly for physician practices. An early study examined BIR spending among California providers and purchasers in 2000 and found that BIR spending varied by stakeholder but is a significant component of overall administrative spending (see Table 3).
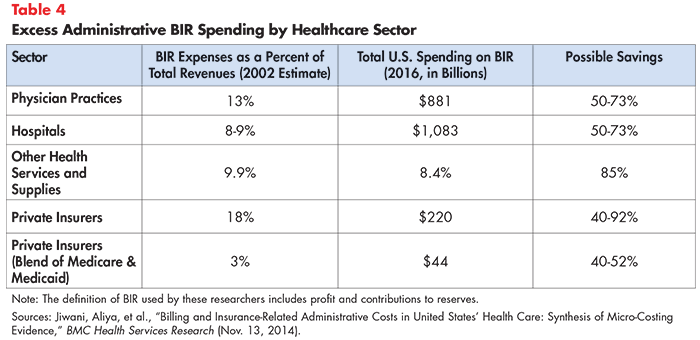
Using the standard of a simplified payment system (such as a single payer) as the rubric, one set of researchers estimated that $375 billion would have been saved from reduced BIR in 2012 (see Table 4).13 Put another way, this excess spending represents about 80 percent of BIR spending in the current multi-payer system, translating to a potential savings of nearly 15 percent of overall healthcare spending.
Both Tables 3 and 4 show significant spending associated with physician offices’ BIR activities, such as interacting with multiple health plans on claims and billing, obtaining prior authorization for patient services, navigating drug formularies and managed care administration. One study found that, in an average week, physicians spent 24 percent of their time on administrative duties related to patient care.14
An earlier 2011 study found that American physicians spent four times as much money interacting with payers as their Canadian counterparts. Providers have difficulty with issues related to prior authorizations and formulary restrictions, high rates of nonpayment for initial reimbursement submissions (10 to 15 percent) and underpayments (5 to 10 percent).15 A recent study found that the share of claims challenged or denied varied significantly by type of insurer, with Medicaid being the most challenging to bill successfully and Medicare the least challenging, although similar to private payers.16
Billing errors and claims payment errors contribute to these delays and represent large, potentially addressable expenses. Estimates of the prevalence of billing errors vary widely:
- In 2013 the American Medical Association estimated that 7.1 percent of claims paid by commercial health insurers contained an error.17
- A 2014 NerdWallet study found mistakes in 49 percent of Medicare claims.18
- A Huffington Post article estimated billing errors occurred in 30-40 percent of medical bills.19
Documentation and Coding
In addition to BIR activities, a time-and-motion study in an ambulatory practice across four specialties found that for every hour a physician spent providing direct clinical care to patients, he or she spent nearly two hours on electronic health record (EHR) and other desk work, plus another one to two hours on documentation each night.20 The EHR and desk work included documentation, file review, accessing test results and arranging medication orders. While many of these administrative tasks might not be considered “excess”—most are tasks that improve patient outcomes—the cumulative effect of administrative burden is of great concern to the profession. Administrative burden is a key cause of physician burnout.21
Marketing, Eligibility and Enrollment
Marketing costs include any costs related to market research; plan and product marketing, design, and campaigns; and public relations and outreach costs. Sales and marketing budgets are typically a significant portion of administrative cost. In fact, approximately 30 percent of private health plan administrative costs reflect sales and marketing activities.22 In recent years, hospitals and large medical groups have increased spending on marketing.23
Two components of these expenses have undergone significant changes due to the Affordable Care Act’s provisions with respect to non-group coverage—the coverage individuals buy on their own. These are worth recalling as the promotion of non-compliant ACA plans could re-introduce theses expenses:
Medical underwriting–common in individual and small group plans prior to the Affordable Care Act reforms that began in 2014 would have been included in earlier estimates of private health plan administrative costs.24 One researcher estimated that underwriting costs might be 2 percent or more of total premiums for small group and non-group carriers.25
Before the ACA, insurance companies on average paid brokers a 5 percent commission based on monthly premiums for plans sold in the individual market, but many health plans are no longer paying commissions.26 One reason for the pressure on commissions is that the ACA’s insurance marketplace was intended to be self-service—robust consumer protections and standardization in coverage enabled people buying plans without a middleman.
Large Gaps in Our Understanding of Excess Administrative Costs
Our current understanding of administrative spending relies on a patchwork of mostly aging analyses, leaving policymakers very much in the dark when it comes to addressing this growing category of healthcare spending.
Moreover, patient administrative burdens have never been tallied,27 representing the greatest gap in our understanding of administrative burden. Patients incur administrative costs when they enroll in coverage, receive care and get reimbursed for expenses. Patients with particularly complex needs may even resort to hiring a patient- or medical-billing advocate or an attorney.
Other data gaps include research to identify potential administrative waste associated with provider credentialing, pre-authorization or grievances and appeals.
Strategies to Address Excess Administrative Spending
Several approaches have been proposed to curtail excess administrative spending, some feasible within our current multi-payer system and some premised on a health system with simplified and streamlined payment methods.
Under all approaches, our first line of defense is to improve data collection.28 Policymakers should require standardized definitions for the components of health system administrative spending and expand data collection efforts, particularly with respect to consumer, physician and hospital administrative spending. The improved and timely information can be used to establish targets to address waste.
Streamlining Administrative Tasks within the Existing Multi-Payer System
- Simplify Health Coverage Eligibility/Reducing Churn: Standardizing and simplifying eligibility criteria for coverage could cut administrative costs, potentially reducing enrollment “churn.”30
- Simplify and Standardize Claim Coding and Payment Rules: Standardizing payer and provider interaction processes and rules: a single, transparent set of payment rules in a multi-payer healthcare system, would potentially reduce the complexity of providers’ billing activities.31
- As an example, Maryland pays its hospitals using all-payer rate setting.32 The prior-authorization process can be standardized to reduce provider burden.33,34 It is not just that each insurer has their own pre-authorization requirements. Rather, each insurer has multiple, different pre-authorization requirements, varying for each specific business they insure or public program they participate in. A third area is severity adjustments that typically accompany the coding of claims. Efforts to upcode and gain more revenue increases the need for administrative staff. A simpler system would reduce the availability of these severity codes, with some risk adjustment and workarounds for some limited number of cases.35
- Provider Accrediting/Licensing: Establishing uniform, national accreditation and licensing standards could reduce costly provider credentialing processes across multiple payers.36 Standardizing licensure reporting requirements for quality and safety programs and minimum criteria will promote greater uniformity and lower compliance expenses.37
- Create all-payer, standardized quality benchmarks so that providers aren’t trying to meet multiple standards: Public and private organizations should work to harmonize and centralize national, state and local regulations, reporting requirements for quality and safety programs, and licensure restrictions. Consider those proposed under the National Strategy for Quality Improvement in Health Care.38
- Optimize health information-technology systems so stakeholders can communicate in real time: Improved connectivity between payer and providers allows faster verification of patient eligibility, patient financial responsibility, referral policies and limits on service.39 While claim submission is almost entirely electronic (95 percent of claims submitted fully electronically), the least automated activities are prior authorization and claim attachment (clinical information that needs to be submitted with a claim). Less than 10 percent of these transactions are fully electronic.40 Moreover, electronic medical record systems cannot interface with billing systems, for example, to automatically submit information for quality assessment.41
Capping Private Health Plan Medical Loss Ratio
Many states and the federal Affordable Care Act require health insurers to devote a minimum proportion of premium revenues to clinical services and quality improvement, a standard known as the Medical Loss Ratio (MLR).42 Prior to the Affordable Care Act, many consumers who purchased coverage in the individual market were in plans spending more than 30 cents of every premium dollar on administrative costs and profit.43 Now, most payers are required to spend 80-85 percent of premium dollars on medical care, and the share they are paying towards administrative costs, quality improvements and profit is correspondingly 20-15 percent.
Policy analysts give this approach mixed marks. Opponents note that this policy provides an incentive to let premiums rise as higher premium revenue means the portion allowed for MLR is a higher dollar amount. On the other hand, insurance products known as short-term plans are not subject to these federal MLR minimums and they have reported loss ratios that are significantly less favorable for consumers. The average loss ratio for short-term policies on the individual market in 2016 was 67 percent; while for the top two insurers, who together sold 80 percent of all short-term policies in this market, the average loss ratio was 50 percent.44
Streamlining Administrative Tasks by Moving to a Single-Payer System
A single-payer system consolidates basic insurance functions into a single entity. Medicare coverage is an example of a single-payer system, with the exception of those enrolled in private Medicare Advantage plans. Billing procedures would be simplified and streamlined under such as system. Similarly, a universal coverage approach can eliminate the expenses associated with determining eligibility for coverage, depending on the specifics of how it is enacted.
As noted above, evidence from the Medicare program demonstrates that large, unified payers can achieve significantly greater efficiencies than multi-payer systems. Unified payment schemes enjoy economies of scale, sharply reduce the burdens of claims processing, and eliminates the need for marketing, advertising and underwriting expenses.
Countries with single-payer systems, such as Denmark and France, have lower spending attributed to governance and administrative costs. Spending related to planning and managing health systems and services, as well as government regulation, accounts for 8 percent of governance and administrative costs in the U.S. In contrast, this type of spending in other developed countries accounts for 1 to 5 percent.45 It is important to note that this analysis does not include hospital profits.
As noted above, one research team estimates a simplified payment system (such as a single payer) would have saved an estimated $375 billion in 2012.46 Put another way, this excess spending represented 80 percent of BIR costs in the current multi-payer system. Simplified financing system in the U.S. could saving nearly 15 percent of healthcare spending.
But how much a single-payer system can cut administrative costs depends on how the plan is designed and implemented. For example, is there a private insurance function that provides supplemental coverage to the public health plan?
Conclusion
While hard estimates of administrative waste in the U.S. healthcare system are hard to come by, comparative data suggests there is significant excess administrative spending. A majority of this spending is associated with our multi-payer financing system which results in a wide variety of rules regarding provider credentialing, quality assurance, billing and payment. Moreover, the consumers’ administrative burden of interacting with this complex system has never been tallied. Indeed, it is barely acknowledged.
In light of the high healthcare affordability burdens being placed on consumers (via premiums, direct out-of-pocket-costs, taxes and foregone wages) and provider burnout associated with administrative burden, it is critical to reduce the burden and spending associated with administrative waste. Critical steps include simplifying and standardizing the myriad, misaligned, payer-specific rules in our current multi-payer system. Additional progress could be made by creating a pathway for states and localities to move to a single-payer system.
Notes
- Bentley, Tanya G. K., et al., “Waste in the U.S. Health Care System: A Conceptual Framework,” The Milbank Quarterly, Vol. 86, No. 4 (December 2008). https://www.ncbi.nlm.nih.gov/pmc/articles/PMC2690367/
- Yong, P.L., R.S. Saunders, and L.A. Olsen, “The Healthcare Imperative: Lowering Costs and Improving Outcomes,” The National Academies Collection (2010). https://www.ncbi.nlm.nih.gov/books/NBK53942/
- Tseng, P., et al., “Administrative Costs Associated with Physician Billing and Insurance-Related Activities at an Academic Health Care System,” JAMA (Feb. 20, 2018). https://jamanetwork.com/journals/jama/article-abstract/2673148
- Ibid.
- Kahn, James G., et al., “The Cost of Health Insurance Administration in California: Estimates for Insurers, Physicians, and Hospitals,” Health Affairs, Vol. 24, No. 8 (November 2005). https://www.healthaffairs.org/doi/full/10.1377/hlthaff.24.6.1629
- Merlis, Mark, “Simplifying Administration of Health Insurance,” National Academy of Social Insurance and National Academy of Public Administration (January 2009). https://www.nasi.org/usr_doc/Simplifying_Administration_of_Health_Insurance.pdf
- Buffie, Nick, “Overhead Costs for Private Health Insurance Keep Rising, Even as Costs Fall for Other Types of Insurance,” Center for Economic and Policy Research (February 2017). http://cepr.net/blogs/cepr-blog/overhead-costs-for-private-health-insurance-keep-rising-even-as-costs-fall-for-other-types-of-insurance
- Merlis (January 2009).
- Ibid.
- Papanicolas, Irene, Liana R. Woskie and Ashish K. Jha, “Health Care Spending in the United States and Other High-Income Countries,” JAMA (March 13, 2018). https://jamanetwork.com/journals/jama/article-abstract/2674671
- Jiwani, Aliya, et al., “Billing and Insurance-Related Administrative Costs in United States’ Health Care: Synthesis of Micro-Costing Evidence,” BMC Health Services Research (Nov. 13, 2014). https://bmchealthservres.biomedcentral.com/articles/10.1186/s12913-014-0556-7
- Cutler, David M., and Dan P. Ly, “The (Paper) Work of Medicine: Understanding International Medical Costs,” Journal of Economic Perspectives, Vol. 25, No. 2 (Spring 2011). https://pubs.aeaweb.org/doi/pdfplus/10.1257/jep.25.2.3
- Jiwani (Nov. 13, 2014).
- Tseng(Feb. 20, 2018).
- Yong(2010).
- Gottlieb, Joshua D., Adam H. Shapiro, and Abe Dunn, “The Complexity of Billing and Paying for Physician Care,” Health Affairs, Vol. 37, No. 4, (April 2018).
- Sullivan, Thomas, “AMA’s National Health Insurer Report Card- $12 Billion Could Be Saved Through Increased Claims Automation,” Policy & Medicine (July 18,2013). https://www.policymed.com/2013/07/amas-national-health-insurer-report-card-12-billion-could-be-saved-through-increased-claims-automation.html
- Lamontagne, Christina, “NerdWallet Health Study: Medical Debt Crisis Worsening Despite Policy Advances,” NerdWallet (Oct. 8, 2014).
- Brenoff, Ann, “There’s a Strong Chance You are Paying for Expensive Medical Billing Mistakes,” Huffington Post (May 17, 2017). https://www.huffpost.com/entry/nearly-90-percent-of-medical-bills-contain-mistakes_n_5902146be4b0af6d718c6e80
- Erickson, S. Rockwern, et al., “Putting Patients First by Reducing Administrative Tasks in Health Care: A Position Paper of the American College of Physicians,” Annals of Internal Medicine (May 2017). http://annals.org/aim/fullarticle/2614079/putting-patients-first-reducing-administrative-tasks-health-care-position-paper
- Tseng(Feb 2018).
- Yong (2010). See also Merlis (January 2009).
- Greene, Jan, “Healthcare Marketers Reshape Ad Strategies,” Modern Healthcare (Oct. 30, 2015).
- Specifically, rating rules changed in the non-group and small group markets to preclude rating or coverage denials based on health status of applicant.
- Merlis(January 2009).
- Jordon, Steve, “Agents miss out after Blue Cross drops commissions on Affordable Care Act plans in Nebraska,” Live Well Nebraska (Dec. 19, 2016).
- By way of analogy, the IRS conducts research on the taxpayer burden of completing tax forms. Among other reasons, this information is statutorily required to inform Congress (through the Office of Management and Budget) and taxpayers (provided in tax return instructions about their average estimated compliance burden).
- Gottlieb (April 2018).
- Wikler, Elizabeth, Peter Bausch, and David M. Cutler, “Paper Cuts: Reducing Health Care Administrative Costs,” Center for American Progress (June 2012). https://dash.harvard.edu/bitstream/handle/1/17190515/33796/papercuts_final.pdf?sequence=1
- The Commonwealth Fund, Time for Change: The Hidden Cost of a Fragmented Health Insurance System, http://www.commonwealthfund.org/publications/testimonies/2003/mar/time-for-change--the-hidden-cost-of-a-fragmented-health-insurance-system (accessed Sept.11, 2018).
- Ibid
- Anderson, Gerard, and Bradley Herring, “The All-Payer Rate Setting Model for Pricing Medical Services and Drugs,” AMA Journal of Ethics (August 2015). https://journalofethics.ama-assn.org/article/all-payer-rate-setting-model-pricing-medical-services-and-drugs/2015-08
- Erickson (May 2017).
- Cutler, David M., “Reducing Health Care Costs: Decreasing Administrative Spending,” Testimony for Senate Committee on Health, Education, Labor and Pensions (July 31, 2018). https://www.help.senate.gov/imo/media/doc/Cutler.pdf
- Anderson (August 2015).
- United Health Group, Health Care Cost Containment- How Technology Can Cut Red Tape and Simplify Health Care Administration (June 2009).
- Wikler(June 2012).
- Ibid.
- Ibid.
- Cutler(July 31, 2018).
- Ibid.
- Centers for Medicare & Medicaid Services, Medical Loss Ratio: Getting Your Money’s Worth on Health Insurance, https://www.cms.gov/CCIIO/Resources/Fact-Sheets-and-FAQs/medical-loss-ratio.html (accessed Oct. 30, 2018).
- Ibid.
- National Association of Insurance Commissioners, 2016 Accident and Health Policy Experience Report, News Release (July 2017).
- Papanicolas (March 13, 2018).
- Jiwani (Nov. 13, 2014).

HEALTHCARE VALUE HUB
The Healthcare Value Hub can help you find free, timely information about policies and practices to achieve health systems that are equitable, affordable, and focused on the goals and needs of the people the system is meant to serve.
Share
![]()
![]()
![]()

Follow
![]()
![]()


![]()