![]()
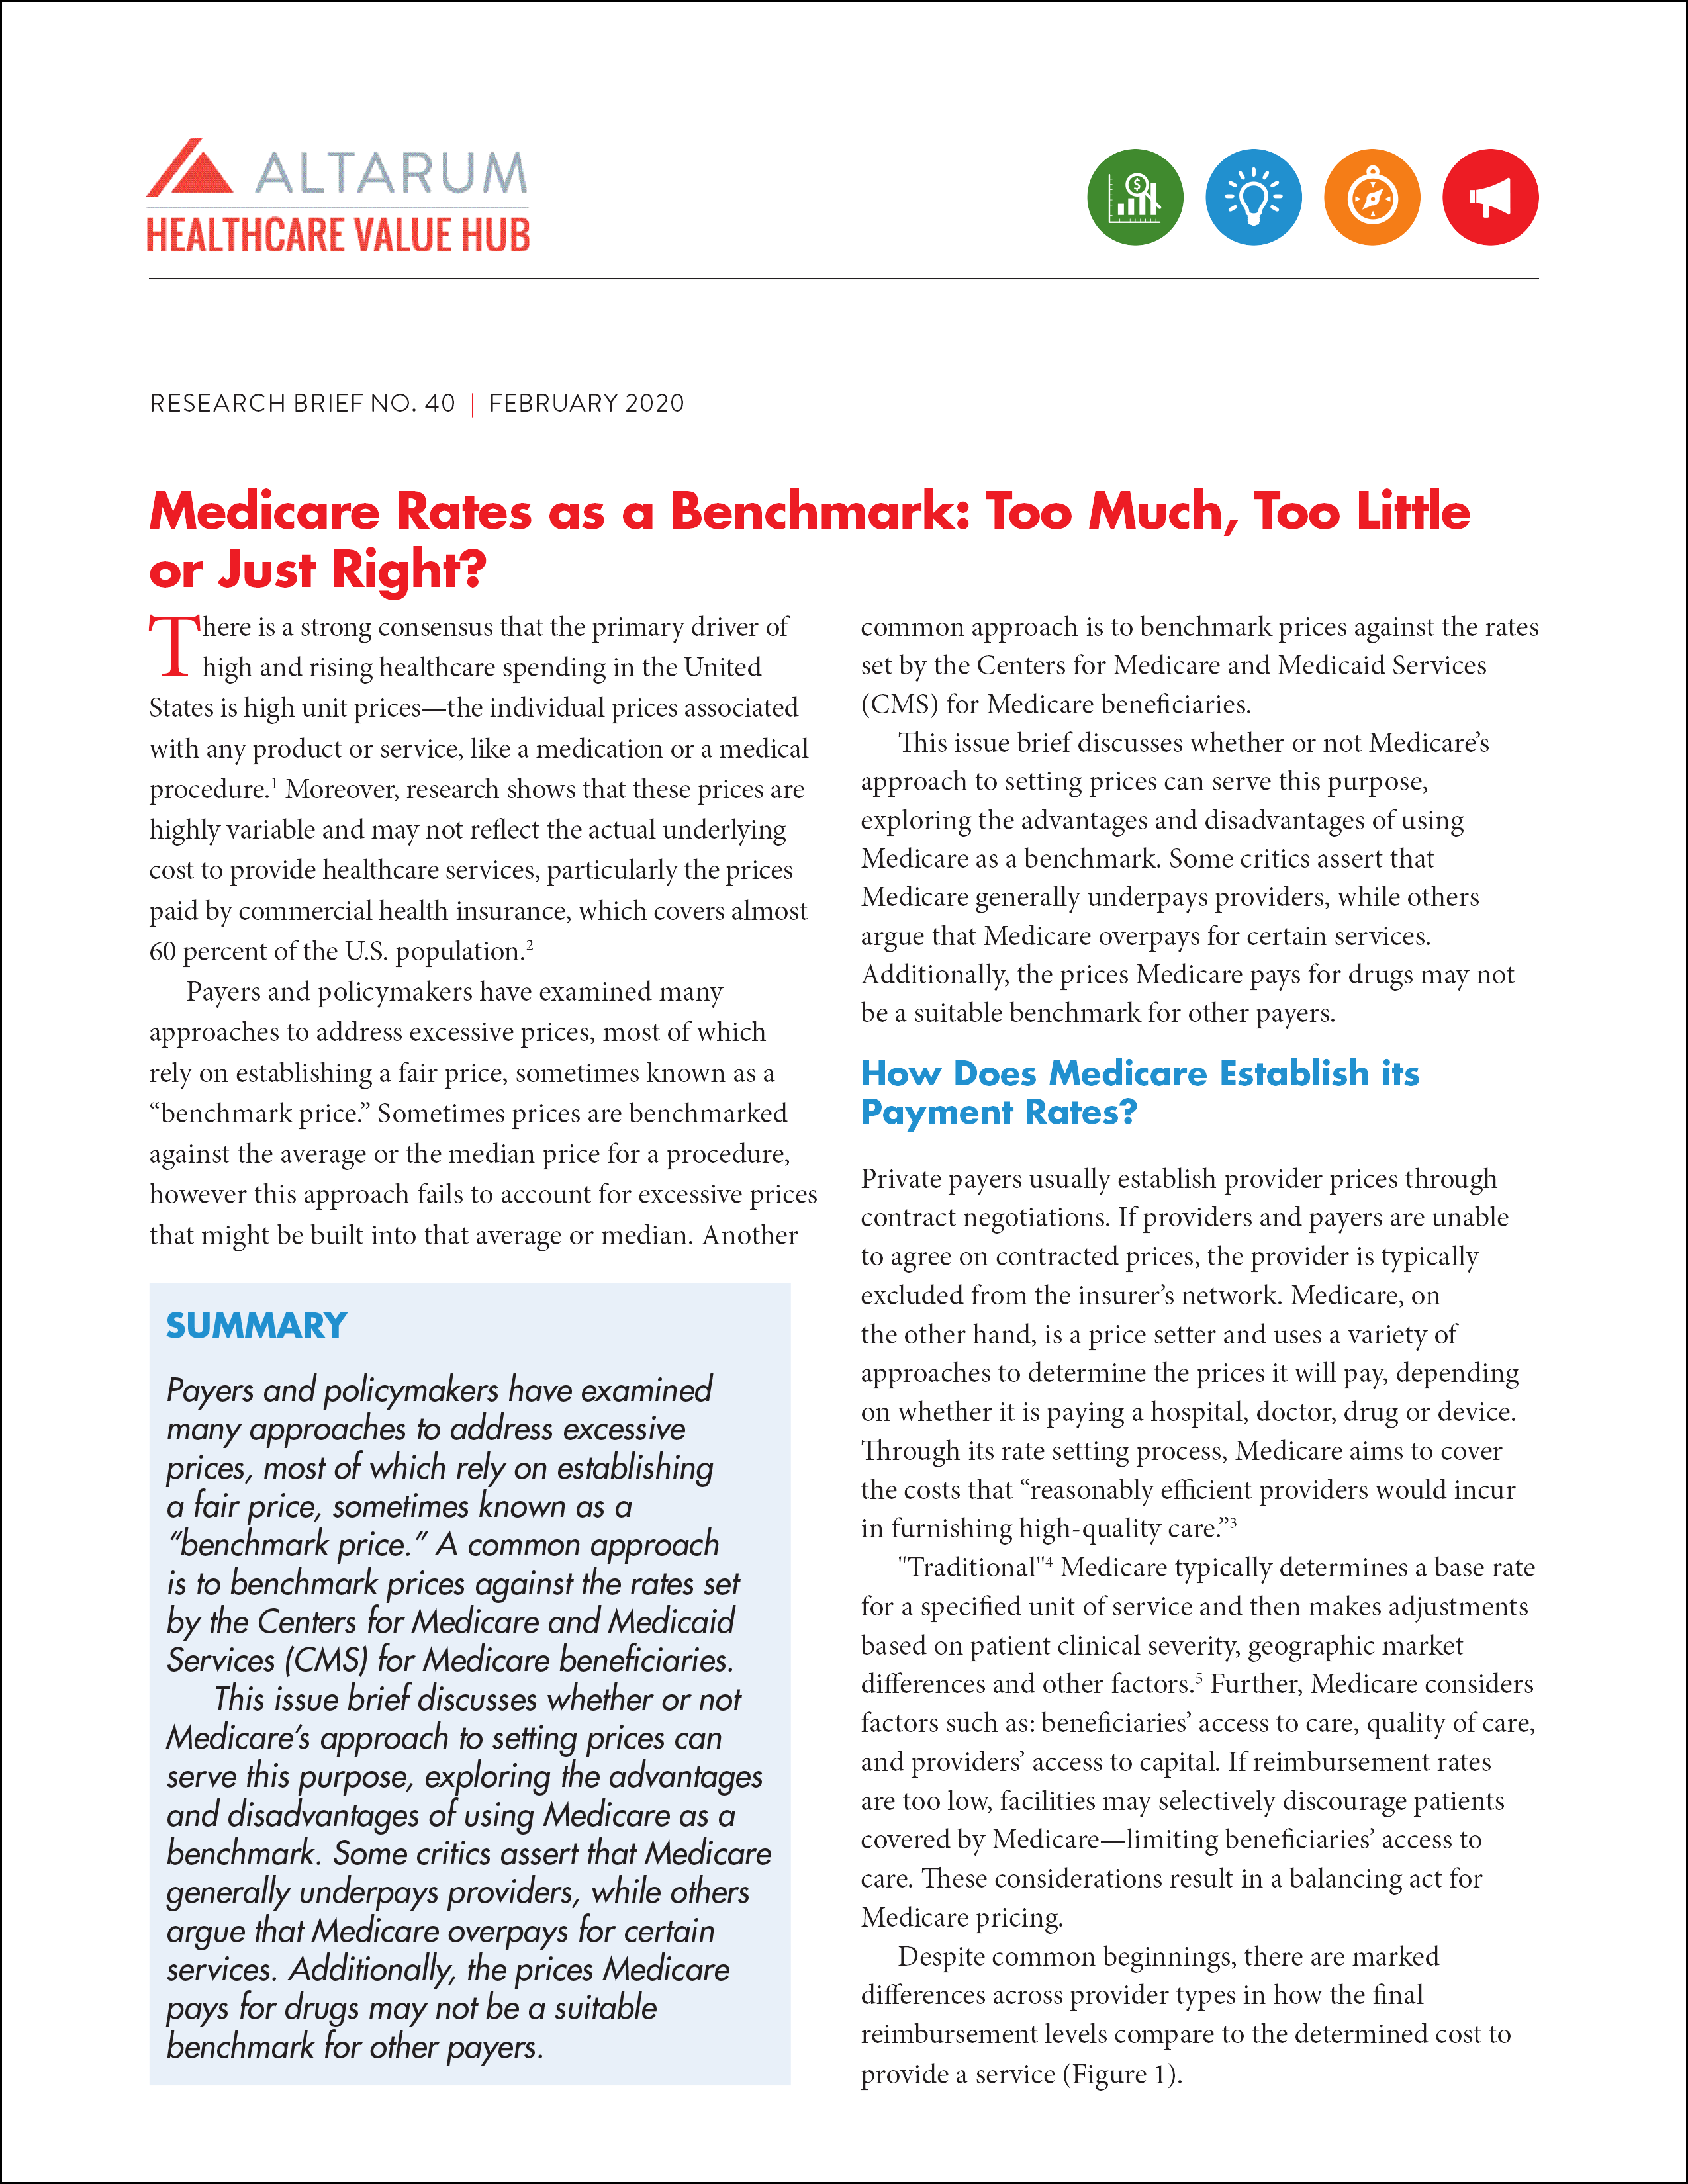
Medicare Rates as a Benchmark: Too Much, Too Little or Just Right?
There is a strong consensus that the primary driver of high and rising healthcare spending in the United States is high unit prices—the individual prices associated with any product or service, like a medication or a medical procedure.1 Moreover, research shows that these prices are highly variable and may not reflect the actual underlying cost to provide healthcare services, particularly the prices paid by commercial health insurance, which covers almost 60 percent of the U.S. population.2
Payers and policymakers have examined many approaches to address excessive prices, most of which rely on establishing a fair price, sometimes known as a “benchmark price.” Sometimes prices are benchmarked against the average or the median price for a procedure, however this approach fails to account for already excessive prices that might be built into that average or median. Another common approach is to benchmark prices against the rates set by the Centers for Medicare and Medicaid Services (CMS) for Medicare beneficiaries.
This issue brief discusses whether or not Medicare’s approach to setting prices can serve this purpose, exploring the advantages and disadvantages of using Medicare as a benchmark. Some critics assert that Medicare generally underpays providers, while others argue that Medicare overpays for certain services. Additionally, the prices Medicare pays for drugs may not be a suitable benchmark for other payers.
How Does Medicare Estalish its Payment Rates?
Private payers usually establish provider prices through contract negotiations. If providers and payers are unable to agree on contracted prices, the provider is typically excluded from the insurer’s network. Medicare, on the other hand, is a price setter and uses a variety of approaches to determine the prices it will pay, depending on whether it is paying a hospital, doctor, drug or device. Through its rate setting process, Medicare aims to cover the costs that “reasonably efficient providers would incur in furnishing high-quality care.”3
"Traditional"4 Medicare typically determines a base rate for a specified unit of service and then makes adjustments based on patient clinical severity, geographic market differences and other factors.5 Further, Medicare considers factors such as: beneficiaries’ access to care, quality of care, and providers’ access to capital. If reimbursement rates are too low, facilities may selectively discourage patients covered by Medicare—limiting beneficiaries’ access to care. These considerations result in a balancing act for Medicare pricing.
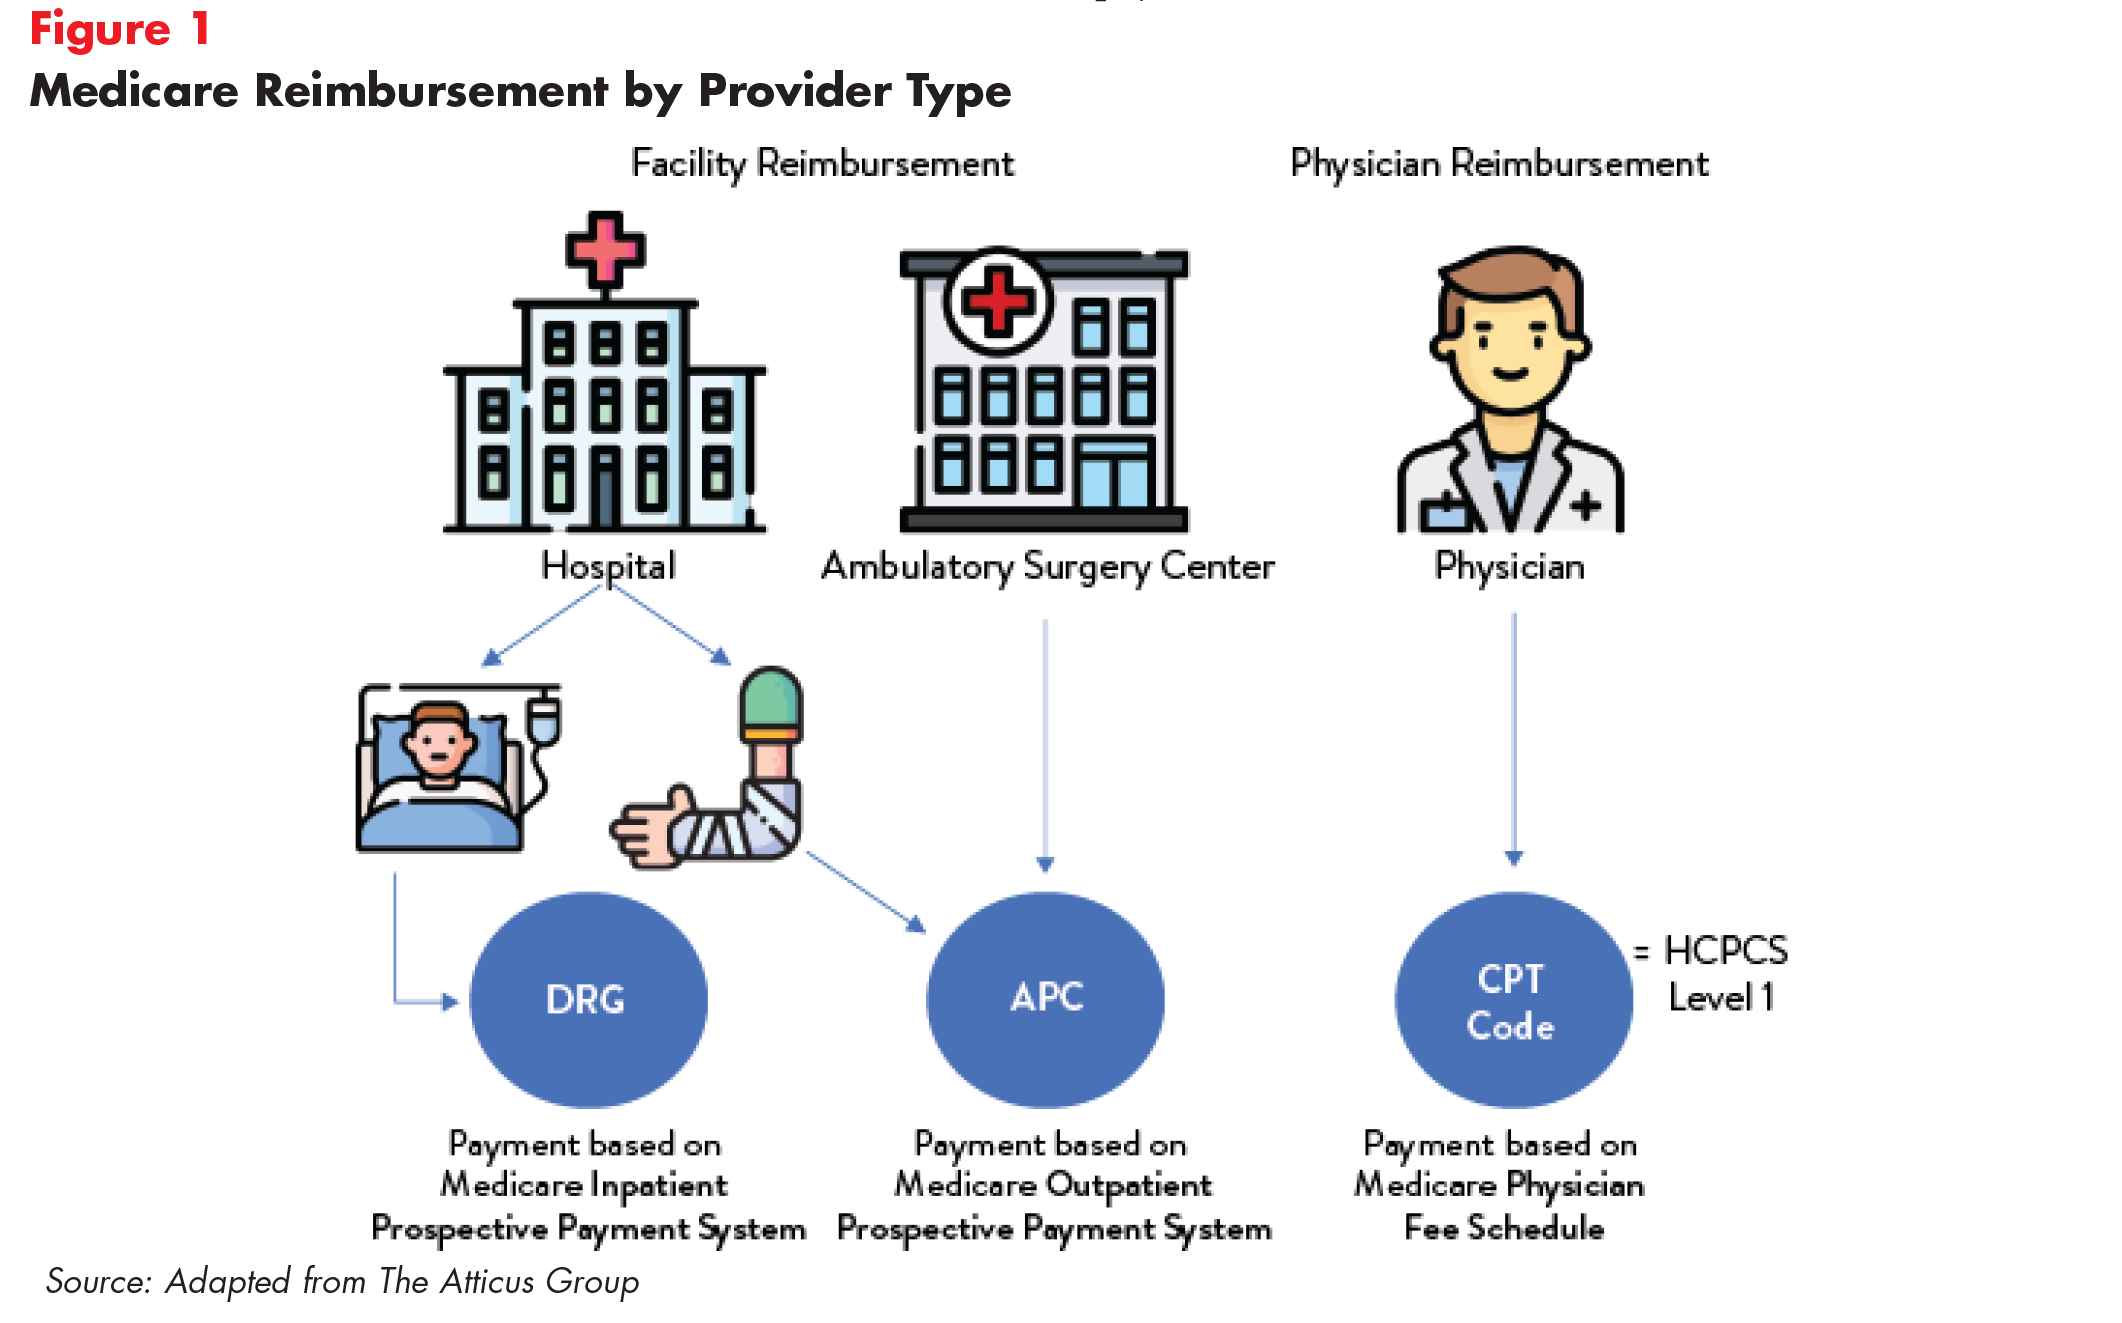
Despite common beginnings, there are marked differences across provider types in how the final reimbursement levels compare to the determined cost to provide a service (Figure 1).
Medicare Reimbursement for Inpatient Hospital Care
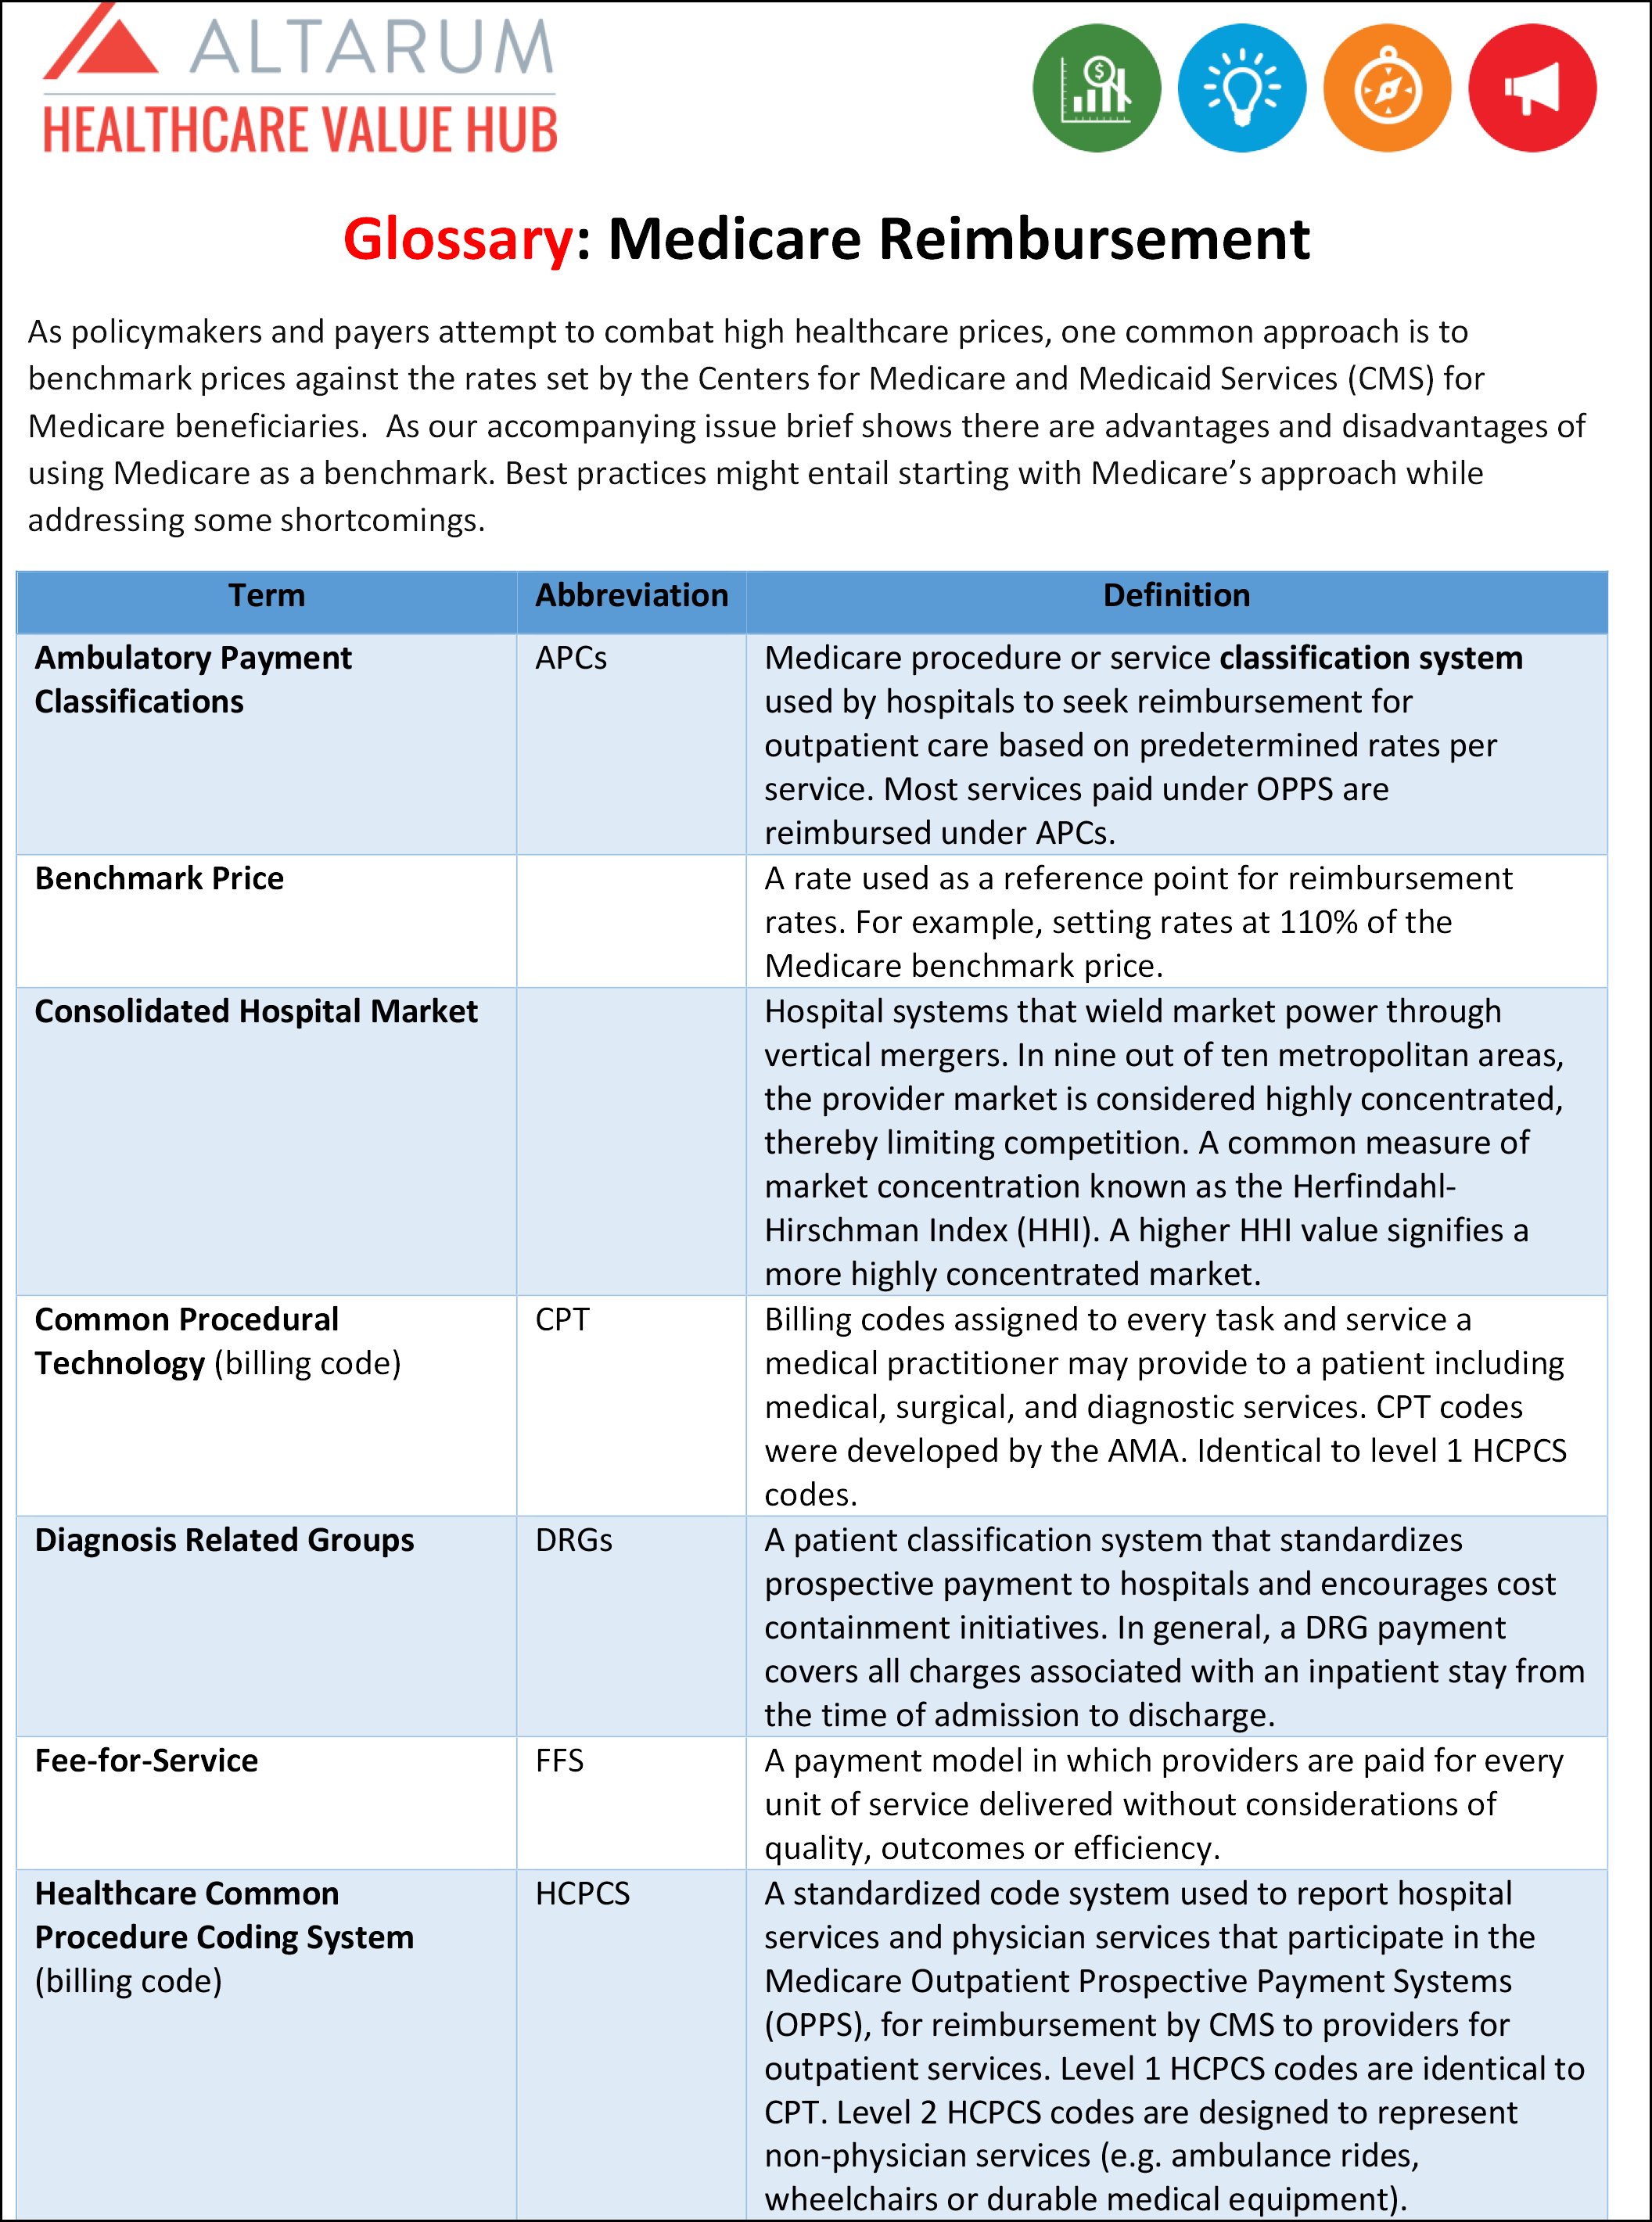
Medicare pays hospitals using the Inpatient Prospective Payment System (IPPS). The base rate for each discharge corresponds to one of over 700 different categories of diagnoses—called Diagnosis Related Groups (DRGs)—that are further adjusted for patient severity. Medicare’s payments to hospitals also account for a portion of hospitals’ capital and operating expenses. Moreover, some hospitals receive additional payments, for example, academic medical centers receive higher payments because they provide graduate medical education and safety-net hospitals receive higher payments for treating a high proportion of indigent patients, in addition to DRG payments.6 Recent Medicare policies can also reduce payments to some hospitals, such as hospitals that have relatively high readmission rates following hospitalizations for certain conditions.7,8
Industry Claims
There is a debate as to whether Medicare underpays hospitals. The American Hospital Association (AHA) has long claimed that Medicare payment rates reimburse below the cost of care for many services. The payment-to-cost ratio represents average payment relative to average cost, with costs including both patient-specific clinical costs and fixed costs such as equipment, buildings and administrators’ salaries. A 2019 AHA survey found that Medicare reimbursement was $53.9 billion lower than actual costs.9 According to the AHA, private insurance payments average 144.8 percent of cost, while payments from Medicare average 86.8 percent of cost.10 The study also revealed that two-thirds of hospitals received payments from Medicare that were less than cost.11
The industry’s claims are supported by Medicare’s own data showing that hospital aggregate (inpatient and outpatient) Medicare profit margins (the difference between total net revenue and total expenses divided by total net revenue) were -9.9 percent in 2017. As a result, MedPAC recommended raising inpatient and outpatient payment rates for 2020.12
Efficiency and Market Power
We note, however, that a hospital’s ratio of payment-to-costs reflect a combination of external factors such as the local costs for wages or utilities and the hospital’s own behavior, including how efficiently it manages its resources.13 A 2019 MedPAC analysis found that hospitals that face greater price pressure operate more efficiently and have lower costs. Relatively efficient hospitals, which MedPAC identified by cost, quality and performance criteria, had higher Medicare margins (-2 percent) than less efficient hospitals.14
Studies have shown that when faced with public payment shortfalls, hospitals in concentrated markets focus on raising prices for private insurers, whereas hospitals in competitive markets focus on cutting costs.15 When hospitals have market power, they can use their leverage to charge private payers higher prices rather than prioritize efficiencies. MedPAC analyses have asserted that hospitals in concentrated or heavily consolidated markets use high revenues from private payers to invest in cost-increasing activities like expanding facilities and clinical technologies—thereby leading to negative margins from Medicare because of an increased cost denominator.16
In contrast, Grand Junction, Colorado, a competitive market and one of the lowest-cost markets in the country, focused on removing inefficiencies by addressing poor prevention practices and unnecessary back operations, while charging patients similar fees across Medicare, Medicaid and private health plans. The result was high quality, low-cost care.17
Moreover, this data rebuts industry assertions that cost-shifting to private payers, or relying more heavily on private plans in their payer mix, is needed to compensate for underpayment from Medicare; evidence suggests that this practice may have more to do with market power than shortfalls resulting from Medicare rates.18
A study conducted by Yale researchers found that hospital market concentration impacts the prices charged to private payers.19 Consolidated market prices in areas with a single hospital were 15 percent higher than those in hospital markets with at least four competitors.Thus, hospitals in consolidated markets may be setting higher private payer prices20 simply because they can and not because they have to compensate for Medicare shortfalls.21
The bottom line is that high-priced hospitals may be operating inefficiently.
Of concern, high profits have the potential to reduce the incentive to become more efficient. Industry observers have pointed to robust hospital all-payer profit margins that have hovered around eight percent since 2012— a level higher than margins in the pharmacy industry or the insurance industry.22 In 2017, all-payer margins were 7.1 percent, which was only 0.1 percent below the all-time high in 2013.23 Not surprisingly, closer examination shows that increasingly high prices charged to private payers are largely responsible for these excessive margins. Moreover, there is concern that the growing divide between private payers and Medicare will incentivize hospitals to focus on privately insured patients, thereby limiting Medicare beneficiaries’ access to care.24
Medicare Reimbursement for Outpatient Hospital Care
Care has been increasingly shifting from the inpatient to the outpatient and ambulatory settings.25 Medicare originally based payments for outpatient care on hospitals’ costs, but CMS began using the Outpatient Prospective Payment System (OPPS) in August 2000.26 This system pays hospitals based on predetermined rates per service using the Ambulatory Payment Classifications (APCs). APCs are associated with one or more Healthcare Common Procedure Coding System codes (HCPCS codes) which are updated annually. This payment method, compared to cost-based reimbursement, aims to incentivize cost-control and to give CMS the ability to predict and manage program expenditures. To account for geographic differences, CMS adjusts the labor portion of the national unadjusted payment rate (60 percent) by the hospital wage index for the area. Payments are further adjusted for rural vs. non-rural, patient severity, and whether the facility complies with certain rules, for example, participating in the hospital Outpatient Quality Reporting Program.
Within this reimbursement framework, Medicare pays differently for services depending on the outpatient setting, namely whether care is received in the offices of physicians and other health professionals, hospital outpatient departments,27 or ambulatory surgical centers.28 CMS currently pays hospitals $75 to $85 more to provide the same procedures as physician practices, though there are no significant differences in outcomes quality. This leads to payment disparities between hospital outpatient departments and community clinics.
As a result, CMS has explored “site-neutral” payments that reimburse providers the same amount, regardless of whether the setting is an independent practice or are hospital-owned. In 2019, the agency announced it would move ahead with a two-year phase-in of reductions in payments for visits and procedures to hospital-owned outpatient clinics in order to equalize payments to independent facilities. The move would save Medicare an estimated $810 million in 2020, while saving beneficiaries an average of $14 per visit. The agency also proposed a wage index increase for struggling rural hospitals, while decreasing the index for high-wage facilities. However, the AHA challenged the decision, arguing that CMS was acting beyond its legal authority.29 A judge ruled that the agency overstepped its statutory authority by decreasing hospital outpatient payment rates for certain services to match those provided by physician practices—striking down the proposal.30
Medicare Reimbursement of Primary Care and Specialists
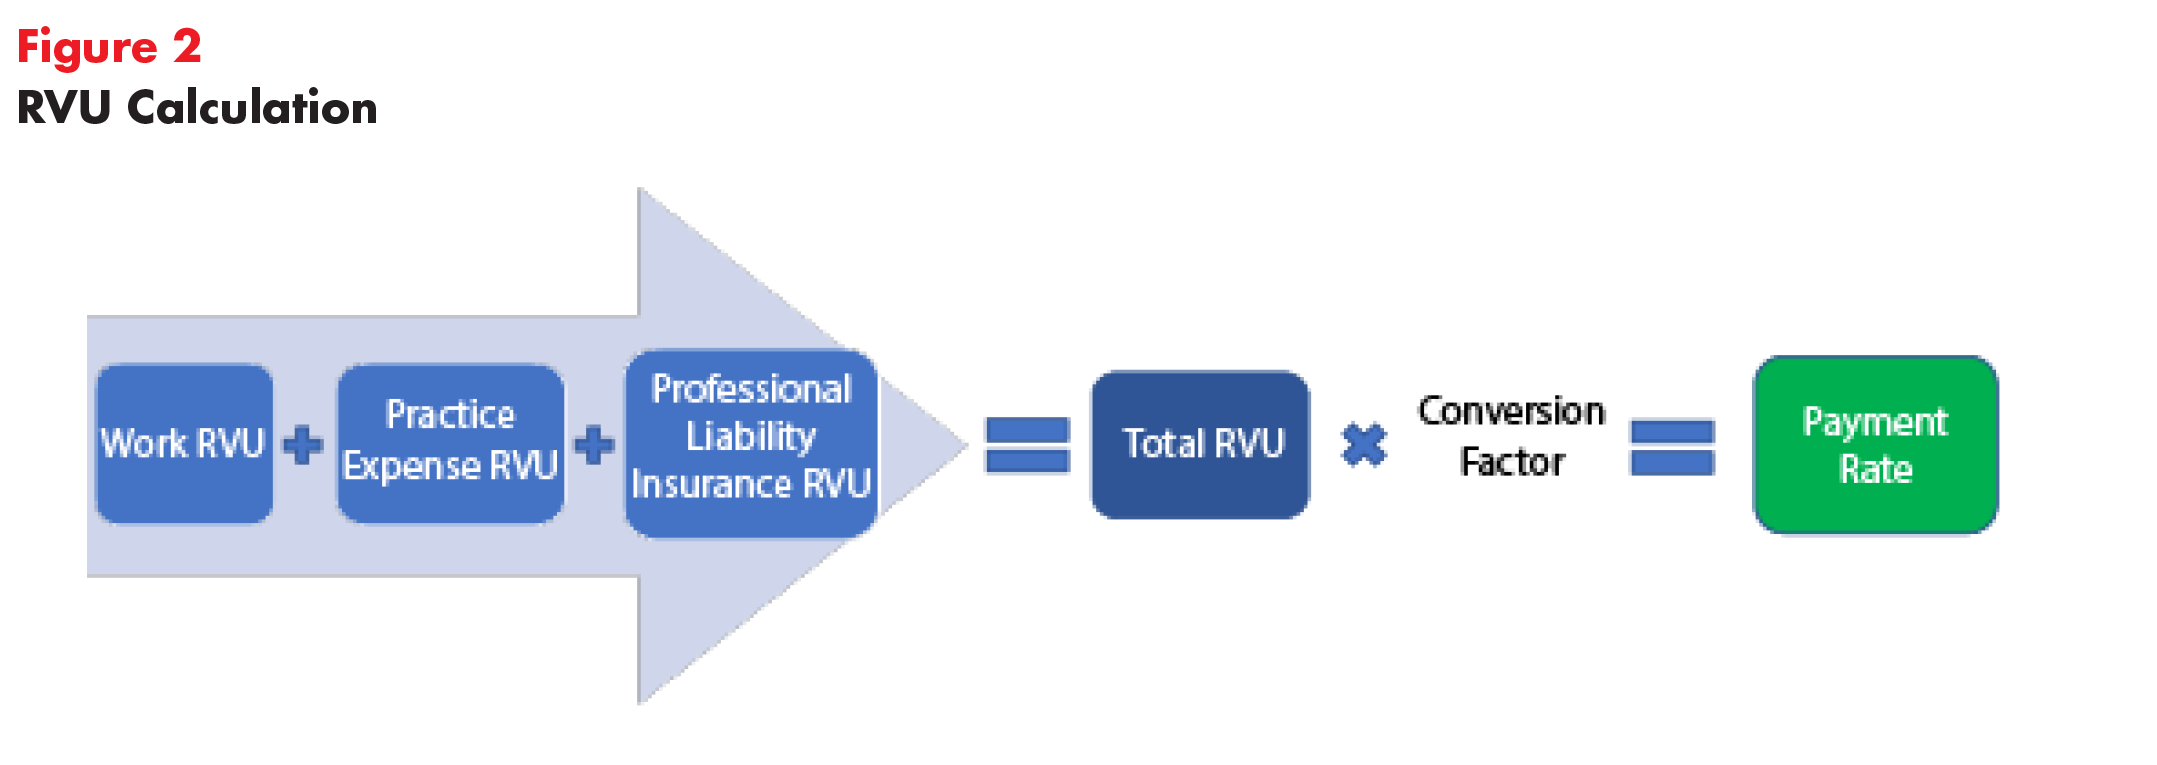
In contrast to underpayment claims from hospital trade groups, some believe that Medicare overpays specialist physicians compared with generalists. In determining physician fee schedules, each year CMS decides how much a physician’s time and effort associated with a given procedure is worth.31 To determine these rates, CMS relies heavily on the American Medical Association’s (AMA) Specialty Society Relative Value Scale Update Committee generally shortened to the Relative Value Update Committee (RUC). The RUC consists of physicians who help shape Medicare relative values by determining the valuation of a physician’s work for a particular activity.32 The Committee assigns RVUs, or Relative Value Units, to tasks based on the amount of “work” it takes a doctor to perform a task, the practice’s cost to perform that task and malpractice liability associated with the task (Figure 2).33 CMS accepted these RUC valuations approximately 90 percent of the time, according to an analysis of fees negotiated between 1994 and 2010.34 However, this number has declined in recent years with CMS accepting 71 percent of RUC RVU recommendations for 2019.35
It is logical to think that physicians are best suited to estimate effort associated with a task or procedure. Nevertheless, critics express concern that allowing physicians to set their own payment rates is an inherent conflict of interest. In 2015, the Government Accountability Office (GAO) found that specialty societies may inflate relative value recommendations for specialty services as a result of disproportionate representation on the RUC.36 Additionally, low response rates (approximately 2.2 percent) from surveyed providers has called RUC’s survey data into question.37 A substantial number of surveys had less than the required 30 responses.38 These findings, coupled with a failure to adequately document its process, led the GAO to conclude that CMS’s heavy reliance on RUC could be resulting in inaccurate Medicare payment rates. For example, an average colonoscopy takes 30 minutes to perform but the RUC assumes the procedure takes 75 minutes.39 A Florida gastroenterologist stated that his regular business day consists of 12 colonoscopies and four other procedures—work that would take him 26 hours by RUC standards.40
Other studies have raised concerns that CMS’ adoption of RUC recommendations disincentivizes generalists by overpaying specialists, exacerbating primary care shortages.41, 42 For example, a radiologist, on average, earns nearly double what a primary care physician earns ($419,000 compared to $237,000 a year).43 While Medicare pays $200 for a screening colonoscopy conducted by a gastroenterologist (a 20 to 30 minute procedure), the program pays primary care physicians $100 for a visit that may take more than half an hour to evaluate a patient’s chronic conditions.44 For physicians reporting work RVUs in 2017, mean total cash compensation for cardiologists, dermatologists and gastroenterologists was nearly double that of primary care physicians.45 This is especially troublesome because longstanding, continuous relationships between primary care doctors and their patients may lower healthcare costs. Studies have shown that a small investment in primary care would lower Medicare costs for inpatient and post-acute care.46
Despite discrepancies between specialist and primary care payment, the issue is more nuanced than declaring that the RUC overpays all specialists. There is a great deal of variation across specialists.
One analysis found that rotating RUC occupancy resulted in a statistically significant three to five percent increase in Medicare expenditures related to corresponding highly specialized procedures. Researchers focused on work RVUs (wRVUs), which are only a portion of the total RVU evaluated by the RUC and are based on time and mental effort required to perform a procedure.47 This indicates that member specialists are likely to value related specialty procedures more highly, especially because changes were not correlated with reimbursement components that are not subject to RUC action (e.g. malpractice RVUs which are computed using malpractice insurance rates).
Experts also suspect that the RUC may undervalue certain treatment categories, like cognitive care. Analyses have revealed that Medicare reimburses physicians 3 to 5 times higher for common procedural services than for cognitive care.48 This may incentive physicians to deliver care in ways that maximize their revenue, for example, by prescribing physician-administered drugs over potentially important but less lucrative cognitive services. This flawed valuation may also result in larger out-of-pocket costs for Medicare beneficiaries who are left to pay for cognitive services on their own. One study showed that 55 percent of psychiatrists accepted Medicare reimbursement, compared to 86 percent for other specialties.49 An estimated one quarter of Medicare beneficiaries experience mental health disorders and many of them are likely to forgo treatment if they cannot afford to pay out-of-pocket.
Upcoding
Another aspect of Medicare payment is whether the unit of payment (amount per inpatient discharge or physician service) invites unintended consequences like upcoding and other behaviors. Hospitals and physician practices may be upcoding, a practice whereby providers use billing codes that reflect a more severe illness or expensive treatment in order to seek a larger reimbursement from Medicare. A study of 364,000 physicians found that a small number billed Medicare for the most expensive type of office visit for established patients at least 90 percent of the time.50 One such example is a Michigan orthopedic surgeon who billed at the highest level for all of his office visits in 2015. The probability that these physician practices are only treating the sickest patients is quite low. In the past, CMS has justified reductions in payments to hospitals and physician groups to compensate for the costs of this upcoding—a vicious cycle we would not want to perpetuate.
Pharmaceutical Drugs in the Retail Setting
Under the Medicare Modernization Act of 2003, which established the Part D benefit that pays for drug purchased from pharmacists, the federal government is prohibited from negotiating or setting prices on behalf of Part D beneficiaries.51 Because of this, Medicare’s prices for pharmaceutical drugs aren’t necessarily lower than those in the commercial market. For the sake of comparison, the Department of Veteran’s Affairs (VA), which can negotiate prices for prescription drugs, pays 40 percent less than Medicare for prescription drugs. Researchers estimate that the Medicare program would have saved $14.4 billion in 2016 if Part D used VA prices.52
Large employer spending on prescription drugs is more akin to Medicare Part D spending. For example, large employers spent $1,134 on average, per user on etanercept (Enbrel) in 2016, while Part D (which is run and administered by private plans), spent $1,610.53 This makes sense, as a higher percentage of Part D beneficiaries had high prescription drug out-of-pocket costs compared to people covered through a large employer. Another analysis revealed minimal spending differences between private insurers and Part D. The top 10 most expensive drugs constituted 18 percent of private spending and 17 percent of Part D spending in 2017.54 For these reasons, Part D drug prices may not serve as a good benchmark for reining in pharmaceutical prices.
Pharmaceutical Drugs Administered by Hospital or Doctors' Offices
Drugs administered by infusion or injection in physician offices and hospital outpatient departments are reimbursed based on the average sales price (ASP), which takes volume discounts and price concessions into account. By statute, Medicare pays 106 percent of ASP (ASP+6 percent). This approach has raised concerns that providers are incentivized to use the most expensive alternative available, in order to leverage their 6 percent of the price. Although hospital groups have argued that the 6 percent markup is necessary to cover administrative complexity and other overhead costs, CMS found no correlation between the 6 percent additional payment and overhead costs.55
When ASP data is not available, CMS reimburses based on wholesale acquisition cost (WAC) plus 6 percent. MedPAC found that WACs were significantly higher than their ASPs, potentially because these prices do not take discounts into account.56 Additionally, ASPs reflect the pricing power of drug companies. Between 2012 and 2019, the average price for the most profitable drug in the world, AbbVie’s Humira, jumped from $19,000 to $60,000.57 Prices for brand name drugs continue to grow, even after they have been on the market for some time. In 2018, retail prices for 267 brand name prescription drugs widely used by older adults increased by an average of 5.8 percent—more than double the inflation rate, according to the AARP Public Policy Institute.58 Thus, drug reimbursement based on ASP calculations may unnecessarily drive up Medicare spending.
What's the Bottom Line?
Medicare’s fee-for-service pricing approach has a useful role to play in our country’s debate over healthcare prices, subject to several caveats. On the plus side, Medicare prices aspire to an admirable goal: rather than let provider market power result in prices that have no bearing on the cost to provide services, Medicare strives to pay prices based on the cost of compensating providers fairly; and prices are adjusted for a variety of factors such as geographic region and facility type.59 Using Medicare fees as a benchmark could also decrease health plan and provider administrative burden by decreasing the resources devoted to negotiation and billing under myriad different contracts.60
On the other hand, current Medicare pricing approaches can also be improved to ensure providers are not underpaid and to remove distortions in how care is provided.
Hospital Inpatient Services. Based on assessments that indicate that rural and critical access hospitals were more likely to have negative operating margins and more prone to closure, it may be advisable to tailor Medicare-based rate-setting procedures to specific hospital markets. The caveats include:
- The more widely used the benchmark price, the more important it becomes to ensure that payment is adequate and the relative prices across complimentary services incentivizes high value care.
One of the rubrics used by CMS is an assessment of whether or not the agency’s rates reimburse hospitals for the incremental costs of treating one more patient.61 However, this is not a viable strategy to ensure adequate Medicare reimbursement rates. In Maryland, for example, hospitals participate in a global budgeting system in which their total revenue is fixed, and their reimbursement does not vary based on whether the payer is Medicare, Medicaid or commercial payer. While utilization savings entail savings overall for the Medicare program, the implied per admission reimbursement under the "all-payer" approach is higher than Medicare pays in other states.62 - Any discussion of price benchmarking or regulation reinforces a fee-for-service payment approach. While evidence has been mixed to date, new approaches to paying providers that emphasize outcomes, incentivize upstream care and discourage unnecessary care will continue to be important. As Maryland’s early experience with hospital all-payer rate setting showed, discharged based hospital reimbursement can promote excess utilization (to increase provider revenues) unless further steps are taken.63 Rate regulation is most effective when combined with other payment reforms. For example, global budgeting can tame overall hospital costs by limiting the total amount spent on services rather than just the price at which care is provided.
Outpatient Services. The tug of war between CMS and hospitals over site-neutral payments will have to be resolved in favor of the former in order for Medicare’s pricing approach to be worth emulating. Resolving legal challenges to site-neutral payments for hospital outpatient care would force providers to compete with ambulatory centers and physician practices, potentially lowering Medicare spending. In the meantime, some private payers are acting aggressively to steer patients away from poor performing or overpriced hospital care when the situation is non-urgent.64 In addition, Medicare’s payment approach should use evidence to increase the number services that are paid as part of a bundle (or “package”) and tie these payments to improved outcomes.65
Specialists vs Primary Care Physician Payment. The current incentive structure created by the RUC undervalues primary care physicians and other cognitive care providers, while overvaluing specialist time. Moreover, rotating RUC membership has a direct impact on pricing for highly specialized services. This creates an incentive for providers to specialize, thus contributing to the current primary care shortage. Ideas for replacing the RUC are few and far between but additional guardrails may be needed to improve the balance between providers.
Retail Drugs. Medicare’s approach to paying for retail drugs does not make use of a “fair” price concept and hence, cannot be recommended for benchmarking. The Bipartisan Policy Center described external reference pricing, which relies on international prices as a benchmark, and internal reference pricing, which ensures that therapeutically similar drugs are priced similarly, as two alternative approaches.66
Drugs Administered in Physician Offices and Hospitals. Reimbursements for hospital-administered drugs based on ASP plus 6 percent may be driving up Medicare spending and incentivizing doctors to prescribe more expensive treatments. This is also an area where alternative payment approaches should be considered.
Notes
1. Healthcare Value Hub, Cost & Quality Problems: Rising Unit Prices, Washington, D.C. https://www.healthcarevaluehub.org/cost-and-quality-problems/browse-cost-driverquality-issue/rising-unit-prices
2. Kaiser Family Foundation, Health Insurance Coverage of the Total Population, Washington, D.C. (2018). https://www.kff.org/other/state-indicator/total-population/?currentTimeframe=0&sortModel=%7B%22colId%22:%22Location%22,%22sort%22:%22asc%22%7D
3. Medicare Payment Advisory Commission, Report to the Congress: Medicare Payment Policy, Washington, D.C. (March 2019). http://www.medpac.gov/docs/default-source/reports/mar19_medpac_entirereport_sec.pdf
4. Medicare Advantage (MA) plans pay hospitals at or slightly above traditional Medicare (TM) rates.
5. Cubanski, Juliette, et al., A Primer on Medicare: Key Facts About the Medicare Program and the People it Covers, Kaiser Family Foundation, Kaiser Family Foundation (March 2015). https://www.kff.org/report-section/a-primer-on-medicare-how-does-medicare-pay-providers-in-traditional-medicare/
6. Villagrana, Marco A., Medicare Graduate Medical Educate Payment: An Overview, Congressional Research Service (February 2019). https://fas.org/sgp/crs/misc/IF10960.pdf
7. Cubanski, Juliette, et al. (March 2015).
8. Ellison, Ayla, "100 things to know about Medicare reimbursement," Becker’s Hospital CFO Report (Feb. 8, 2017). https://www.beckershospitalreview.com/finance/100-things-to-know-about-medicare-reimbursement-2017.html
9. American Hospital Association, Underpayment by Medicare and Medicaid Fact Sheet – January 2019 (January 2019). https://www.aha.org/factsheet/2019-01-02-underpayment-medicare-and-medicaid-fact-sheet-january-2019
10. American Hospital Association, Trend Watch Chartbook 2018: Trends Affecting Hospitals and Health Systems, Washington, D.C. (2018). https://www.aha.org/system/files/2018-07/2018-aha-chartbook.pdf
12. Medicare Payment Advisory Commission (March 2019).
13. Gee, Emily, The High Price of Hospital Care, Center for American Progress (June 2019). https://www.americanprogress.org/issues/healthcare/reports/2019/06/26/471464/high-price-hospital-care/f
14. Ibid.
15. Robinson, James, “Hospitals Respond To Medicare Payment Shortfalls By Both Shifting Costs And Cutting Them, Based On Market Concentration,” Health Affairs, Vol. 30, No. 7 (July 2011). https://www.healthaffairs.org/doi/full/10.1377/hlthaff.2011.0220
16. Ibid.
17. Gawande, Atul, “The Cost Conundrum: What a Texas town can teach us about health care,” The New Yorker (May 2009). https://www.newyorker.com/magazine/2009/06/01/the-cost-conundrum
18. Kronick, Richard, and Sarah Hoda Neyaz, Private Insurance Payments to California Hospitals Average More Than Double Medicare Payments, West Health Policy Center (May 2019). https://s8637.pcdn.co/wp-content/uploads/2019/05/West-Health-Policy-Center-Hospital-Pricing-Analysis-May-2019.pdf
19. Cooper, Zach, et al., "The Price Ain’t Right? Hospital Prices and Health Spending on the Privately Insured," The Journal of Economics, Vol. 134, No. 1 (September 2018). https://isps.yale.edu/research/publications/isps15-027
20. MedPAC notes that commercial payments to hospitals are often 50 percent above Medicare payment rates. Along similar lines, researchers at RAND found that private health plans pay hospitals 241 percent, on average, of what Medicare pays for the same services. See White, Chapin, and Christopher Whaley, Prices Paid to Hospitals by Private Health Plans Are High Relative to Medicare and Vary Widely: Findings from an Employer-Led Transparency Initiative, RAND Corporation, Santa Monica, C.A. (2019). https://www.rand.org/pubs/research_reports/RR3033.html
21. For example, in 2017, uncompensated and undercompensated care amounted to $2.3 billion in Colorado. In that same year, private health plans paid hospitals $3.5 billion more than hospital input costs (a $1.2 billion difference).
22. Belk, David, Hospital Financial Analysis, True Cost of Health Care. http://truecostofhealthcare.org/hospital_financial_analysis/. Experiences among individual hospitals vary, however, and about one-quarter of both for-profit and not-for-profit hospitals lost money in 2016.
23. Medicare Payment Advisory Commission (March 2019). http://www.medpac.gov/docs/default-source/reports/mar19_medpac_entirereport_sec.pdf
24. Ibid.
25. Outpatient care is covered by Medicare Part B, which requires beneficiaries to pay a premium, deductible and copays.
26. MedPAC, Outpatient Hospital Services Payment System (October 2018). http://medpac.gov/docs/default-source/payment-basics/medpac_payment_basics_18_opd_final_sec.pdf?sfvrsn=0
27. MedPAC does not breakout Hospital Outpatient margins separately from inpatient.
28. ACS’s do not provide cost reports, hence, MedPAC cannot determine margin for these entities.
29. Meyer, Harris, “Medicare proposes range of pay cuts, increases for outpatient services,” Modern Healthcare (August 2019). https://www.modernhealthcare.com/payment/medicare-proposes-range-pay-cuts-increases-outpatient-services
30. LaPointe, Jacqueline, “Winners, Losers of the Medicare Site-Neutral Payment Policy Ruling,” RevCycleIntelligence (September 2019). https://revcycleintelligence.com/news/winners-losers-of-the-medicare-site-neutral-payment-policy-ruling
31. Laugesen, Miriam J., Roy Wada, and Eric M. Chen, “In Setting Doctors’ Medicare Fees, CMS Almost Always Accepts The Relative Value Update Panel’s Advice On Work Values,” Health Affairs, Vol. 31, No. 5 (May 2012). https://www.healthaffairs.org/doi/full/10.1377/hlthaff.2011.0557
32. American Medical Association, RVS Update Committee (RUC). https://www.ama-assn.org/about/rvs-update-committee-ruc/rvs-update-committee-ruc (accessed on Feb. 27, 2020).
33. Dervan, Andrew, Do RVU-based compensation models undervalue PCPs?, Internal Medicine, University of Washington. https://www.sgim.org/file%20library/sgim/communities/advocacy/advocacy%20101/do-rvus-undervalue-primary-care---primer-on-the-ruc-3-14-2014.pdf
34. Laugesen, Miriam J. (May 2012).
35. American Medical Association, File Code CMS-1693-P; Revisions to Payment Policies under the Physician Payment Schedule and Other Revisions to Part B for CY 2019, Washington, D.C. (July 27, 2018). https://j2vjt3dnbra3ps7ll1clb4q2-wpengine.netdna-ssl.com/wp-content/uploads/2018/11/AMA-RUC-comment-CMS-8-30-18.pdf
36. 23 out of 31 RUC members belong to specialty societies. See American Medical Association, Composition of the RVS Update Committee (RUC). https://www.ama-assn.org/about/rvs-update-committee-ruc/composition-rvs-update-committee-ruc
37. RUC surveys are sent to doctors to help create descriptions for procedures, uncover the time it takes to perform a service, determine whether certain procedures require multiple visits and assess the technical skill required to perform a given procedure. See American Society of Echocardiography, What is the RUC and RUC Survey? https://www.asecho.org/what-is-the-ruc-and-ruc-survey/
38. U.S. Government Accountability Office, Medicare Physician Payment Rates: Better Data and Greater Transparency Could Improve Accuracy (May 2015). https://www.gao.gov/products/GAO-15-434
39. Whoriskey, Peter, and Dan Keating, “How a secretive panel uses data that distorts doctors’ pay,” The Washington Post (July 2013). https://www.washingtonpost.com/business/economy/how-a-secretive-panel-uses-data-that-distorts-doctors-pay/2013/07/20/ee134e3a-eda8-11e2-9008-61e94a7ea20d_story.html
40. Ibid.
41. Shadowfax, "Ranting on the RUC," MedPage Today (November 2007). https://www.medpagetoday.com/blogs/shadowfax/7516
42. The AAMC estimates that by 2030, the U.S. primary care shortfall will reach 49,000 due to underpayment. See Lazris, Andy, Alan Roth, and Shannon Brownlee, “No More Lip Service; It’s Time We Fixed Primary Care (Part Two),” Health Affairs (November 2018). https://www.healthaffairs.org/do/10.1377/hblog20181115.163117/full/
43. O’Connor, Matt, Radiologists average $419K per year, ranking 6th among specialists, HealthImaging (April 2019). https://www.healthimaging.com/topics/healthcare-economics/radiologists-average-419k-year-6th-among-specialists
44. Jain, Manoj, "Disparity in Pay Divides Doctors," The Washington Post (October 2012). https://www.washingtonpost.com/national/health-science/disparity-in-pay-divides-doctors/2012/10/22/675233a8-f1e0-11e1-a612-3cfc842a6d89_story.html
45. Zuckerman, Stephen, et al., Analysis of Disparities in Physician Compensation, MedPAC (January 2019). http://www.medpac.gov/docs/default-source/contractor-reports/jan19_medpac_disparities_physiciancompensationreport_cvr_contractor_sec.pdf
46. Reschovky, James D., et al., Paying More for Primary Care: Can It Help Bend the Medicare Cost Curve, The Commonwealth Fund (March 2012). https://www.commonwealthfund.org/sites/default/files/documents/___media_files_publications_issue_brief_2012_mar_1585_reschovsky_paying_more_for_primary_care_finalv2.pdf
47. Gao, Y. Nina, “Committee Representation and Medicare Reimbursements—An Examination of the Resource‐Based Relative Value Scale,” Health Services Research, Vol. 53, No. 6 (December 2018). https://www.ncbi.nlm.nih.gov/pmc/articles/PMC6232394/
48. Calsyn, Maura, and Madeline Twomey, Rethinking the RUC: Reforming How Medicare Pays for Doctors’ Services, Center for American Progress (July 2018). https://www.americanprogress.org/issues/healthcare/reports/2018/07/13/453159/rethinking-the-ruc/
49. Ibid.
50. Ornstein, Charles, and Ryann Grochowski, “Some Doctors Still Billing Medicare for the Most Complicated, Expensive Office Visits,” ProPublica (December 2017). https://www.propublica.org/article/some-doctors-still-billing-medicare-for-the-most-complicated-expensive-office-visits
51. Freedm Meredith, Juliette Cubanski, and Tricia Neuman, A Look at Recent Proposals to Control Drug Spending by Medicare and its Beneficiaries, Kaiser Family Foundation (November 2019). https://www.kff.org/medicare/issue-brief/a-look-at-recent-proposals-to-control-drug-spending-by-medicare-and-its-beneficiaries/
52. Venker, Brett, Kevin B. Stephenson, and Walid F. Gellad, “Assessment of Spending in Medicare Part D If Medication Prices From the Department of Veterans Affairs Were Used,” JAMA Internal Medicine, Vol. 179, No. 3 (January 2019). https://jamanetwork.com/journals/jamainternalmedicine/fullarticle/2720124
53. The Center for Biosimilars, Enbrel, Humira Top Prescription Drug Spending for Those Covered Through Large Employer Plans (May 2019). https://www.centerforbiosimilars.com/news/enbrel-humira-top-prescription-drug-spending-for-those-covered-through-large-employer-plans
54. Heath, Sara, Prescription Drug Spending Varies by Private, Public Payers,” HealthPayerIntelligence (May 2019). https://healthpayerintelligence.com/news/prescription-drug-spending-varies-by-private-public-payers
55. Ross, Martie, and Lori Foley, Effective January 1, 2019 – Changes to Part B. Drug Pricing, PYA (November 2018). https://www.pyapc.com/insights/effective-january-1-2019-changes-to-part-b-drug-pricing/
56. MedPAC, Medicare Part B drug payment policy issues. Washington, D/c/ (n.d) http://www.medpac.gov/docs/default-source/reports/jun17_ch2.pdf?sfvrsn=0
57. Entis, Laura, “Why Does Medicine Cost So Much? Here's How Drug Prices Are Set,” Time (April 2019). https://time.com/5564547/drug-prices-medicine/
58. Purvis, Leigh, and Dr. Stephen Schondelmeyer, Rx Price Watch Report: Brand Name Drug Prices Increase More than Twice as Fast as Inflation in 2018, AARP Public Policy Institute. https://www.aarp.org/ppi/info-2019/trends-in-retail-prices-of-drugs.html
59. White, Chapin, and Christopher Whaley, Prices Paid to Hospitals by Private Health Plans Are High Relative to Medicare and Vary Widely: Findings from an Employer-Led Transparency Initiative, RAND Corporation, Santa Monica, C.A. (2019). https://www.rand.org/content/dam/rand/pubs/research_reports/RR3000/RR3033/RAND_RR3033.pdf
60. Quincy, Lynn and Dakota Staren, Excess Administrative Spending in Healthcare: Significant Savings Possible, Altarum's Healthcare Value Hub, Washington, D.C. (November 2018). https://www.healthcarevaluehub.org/advocate-resources/publications/excess-administrative-spending-healthcare-significant-savings-possible
61. As MedPAC’s own report states, average Medicare margins continue to be negative, although hospitals with excess capacity still have an incentive to see Medicare beneficiaries because Medicare payment rates remain about 8 percent higher than the variable costs associated with Medicare patients. See Medicare Payment Advisory Commission, Report to the Congress: Medicare Payment Policy, Washington, D.C. (March 2019). http://www.medpac.gov/docs/default-source/reports/mar19_medpac_entirereport_sec.pdf
62. RTI International, Evaluation of the Maryland All-Payer Model: Third Annual Report, Washington, D.C. (March 2018). https://downloads.cms.gov/files/cmmi/md-all-payer-thirdannrpt.pdf
63. Butto, Erin, Healthcare Value Hub, Hospital Rate Setting: Promising, but Challenging to Replicate, Altarum's Healthcare Value Hub, Washington, D.C. (August 2017). https://www.healthcarevaluehub.org/advocate-resources/publications/hospital-rate-setting-promising-challenging-replicate
64. Numerof, Rita, “Payers Will Put An End To The AHA’s Predictable Resistance To Site-Neutral Payments,” Forbes (November 2019). https://www.forbes.com/sites/ritanumerof/2019/11/15/payers-will-put-an-end-to-the-ahas-predictable-resistance-to-site-neutral-payments/#5162029f10d4
65. MedPAC, Outpatient Hospital Services Payment System (October 2018). http://medpac.gov/docs/default-source/payment-basics/medpac_payment_basics_18_opd_final_sec.pdf?sfvrsn=0
66. Hoagland, G. William, et al., Examining Two Approaches to U.S. Drug Pricing, Bipartisan Policy Center (October 22, 2019). https://bipartisanpolicy.org/report/examining-two-approaches-to-u-s-drug-pricing/

HEALTHCARE VALUE HUB
The Healthcare Value Hub can help you find free, timely information about policies and practices to achieve health systems that are equitable, affordable, and focused on the goals and needs of the people the system is meant to serve.
Share
![]()
![]()
![]()

Follow
![]()
![]()


![]()