California Residents Worry about High Hospital Costs; Have Difficulty Estimating Quality/Cost of Care; and Express Broad Bipartisan Support for Government Action
Hospitals provide essential services and are vital to the well-being of our communities. However, a survey 1,129 California adults, conducted from November 3, 2022 to November 15, 2022, finds that many California respondents worry about hospital costs and support a variety of policy solutions to address it across party lines.
Hardship and Worry about Hospital Costs
A substantial portion of California respondents worry about affording healthcare costs both now and in the future, and many reported experiencing financial hardship due to hospital costs. Nearly three in five (59% of) respondents reported being “worried” or “very worried” about affording medical costs from a serious illness or accident.
Respondents with Medi-Cal, California’s Medicaid program, reported the highest rates of worry about affording medical costs from a serious illness or accident (73%), followed by Californians who purchase insurance on their own (67%), and those who receive insurance coverage through their employer or a family member’s employer (60%). Respondents with coverage through Medicare reported the lowest rates of worry about affording medical costs from a serious illness or accident (35%).
Skills Navigating Hospital Care
California respondents reported fairly high confidence in their ability to know when to seek emergency care, with 62% reporting that they are very or extremely confident about knowing when to go to the emergency department versus a primary care provider. However, confidence in knowing when to seek care from a hospital emergency department rather than a primary care provider varies by insurance status. While nearly three-fourths (73%) of respondents covered by Medicare, coverage for seniors and those with serious disabilities, reported high confidence navigating emergency departments and primary care, only 63% of respondents with private insurance through an employer, 60% of respondents with private insurance through the marketplace and 59% of respondents covered by Medi-Cal feel confident choosing between the two.
Similarly, confidence in making an appointment with a care provider, clinic or health center varies by respondents’ insurance type. While 80% of respondents covered by Medicare feel confident making an appointment, only 76% of respondents with health insurance through an employer, 73% of respondents with private insurance they have purchased on their own and 67% of those covered by Medi-Cal feel confident making an appointment with a care provider.
Moreover, California residents are less confident in their ability to find hospital costs and quality information. Forty-seven percent of respondents are NOT confident they can find out the cost of a procedure ahead of time, and 46% are NOT confident they can find quality ratings for hospitals.
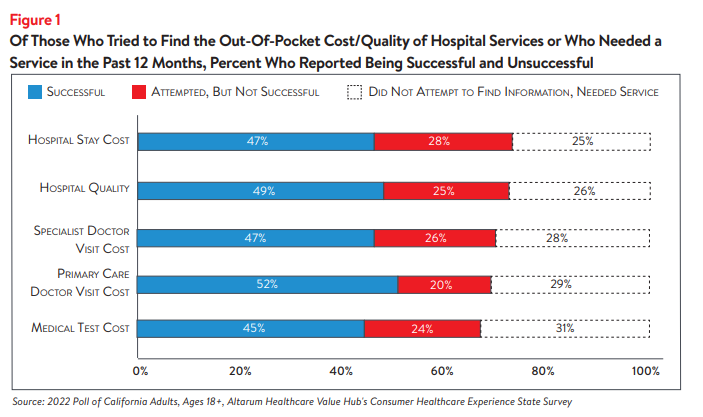
Out of all respondents, 34% tried to find the COST of a hospital stay ahead of time and 11% needed a hospital stay but did not search for cost information. Out of those respondents who reported needing a hospital service and were interested in cost information, 47% reported finding the cost information they were looking for, 28% did not find the cost information they were looking for and 25% did not attempt to find cost information when they needed a hospital stay.
Forty percent of all respondents reported that they have tried to find information on hospital QUALITY and 14% needed a hospital stay but did not try to look for quality information. Out of those respondents who reported needing a hospital service and were interested in quality information, 49% were successful at finding quality information, 25% were unsuccessful and 26% did not attempt to find quality information when they needed a hospital stay (see Figure 1). Figure 1 also captures other healthcare costs integral to hospital services, including medical tests and primary care/specialist doctor visits.
Among respondents who needed a hospital stay but did not seek out price or quality information, the most frequently reported reasons for not seeking information were:
- 35%–Followed their doctors’ recommendations or referrals
- 31%–Did not know where to look
- 28%–The act of looking for information felt confusing or overwhelming
- 20%–Did not have time to look
Notably, few of these respondents reported that out-of-pocket cost or quality were unimportant to them (12%, and 7%, respectively).
Respondents who were unsuccessful searching for cost information identified several barriers, including that the resources available to search for price information were confusing (36%), that their insurance plan or provider, doctor or hospital would not give them a price estimate (36% and 37%, respectively) and that price information was insufficient (24%). In unsuccessful searches for hospital quality information, respondents reported that resources available to search for quality information were confusing (28%) and that the quality information available was not sufficient (20%).
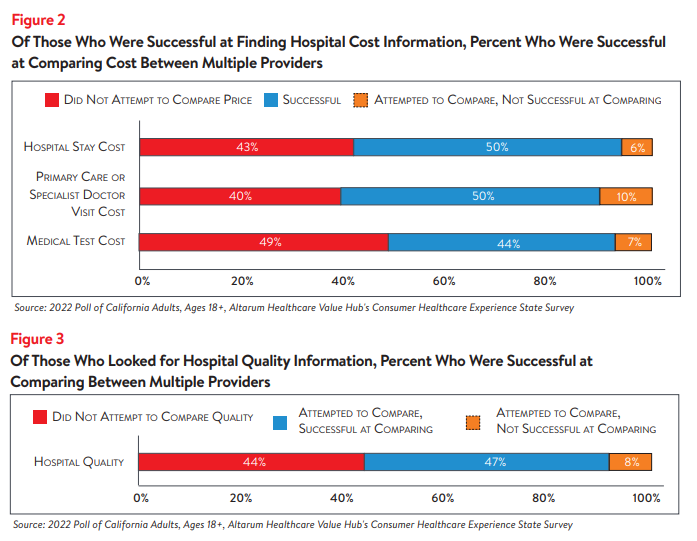
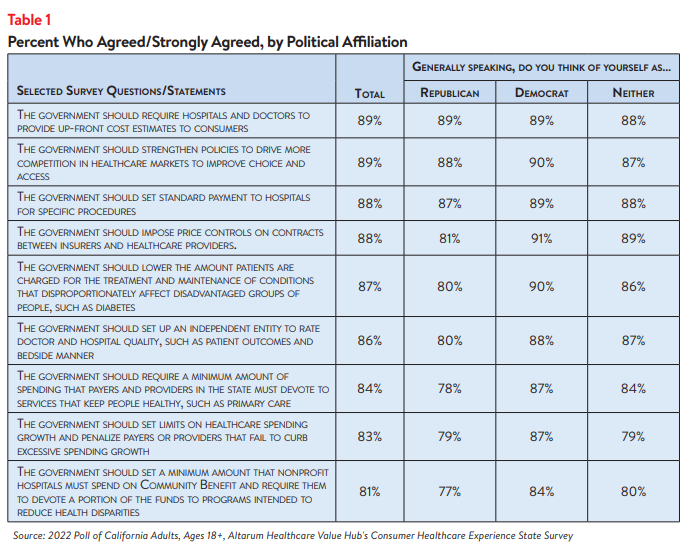
Among those who were successful at finding hospital cost or quality information, nearly half reported not comparing prices or quality between providers (i.e. “shopping”). Still, 50% compared costs between multiple hospitals and 47% compared quality between multiple hospitals (see Figure 2 and Figure 3, respectively).
Among those that did compare cost or quality information for different services, many reported that the cost or quality comparison ultimately influenced their choice of which provider to seek care from. Eighty-two percent who compared primary care or specialist doctor visit costs, 82% who compared medical test costs and 88% who compared hospital stay costs said the comparison influenced their choice. Among those who compared hospital quality information 88% had their choice influenced by the information.
Although many of the respondents who sought out hospital price and quality information were ultimately successful, many respondents never attempted to find this information. Even among those who were successful at finding hospital cost or quality information, roughly half did not compare prices or quality between providers (i.e. “shopping”). Respondents identified a variety of barriers to finding and comparing cost and quality information, including following doctors’ recommendations, confusion over where or how to find cost or quality information and providers and insurers not providing cost estimates. These reasons could also be influenced by this information not being accessible, despite federal price transparency mandates for hospitals.1
These results suggest consumers don’t view healthcare as a shoppable commodity, especially in emergency situations and settings that lack a selection of treatments/providers. Lack of knowledge of hospital quality and potential costs impedes California residents’ ability to plan for needed care and budget for the expense of a hospital stay, which can be costly,2 particularly for residents who are un- or under-insured.
Support for Solutions Across Party Lines
Hospitals, along with drug manufacturers and insurance companies, are viewed as a primary contributor to high healthcare costs. When given more than 20 options, those that California respondents most frequently cited as being a “major reason” for high healthcare costs were:
- 72%–Drug companies charging too much money
- 69%–Hospitals charging too much money
- 67%–Insurance companies charging too much money
- 55%–Large hospitals or doctor groups using their influence to get higher payments from insurance companies
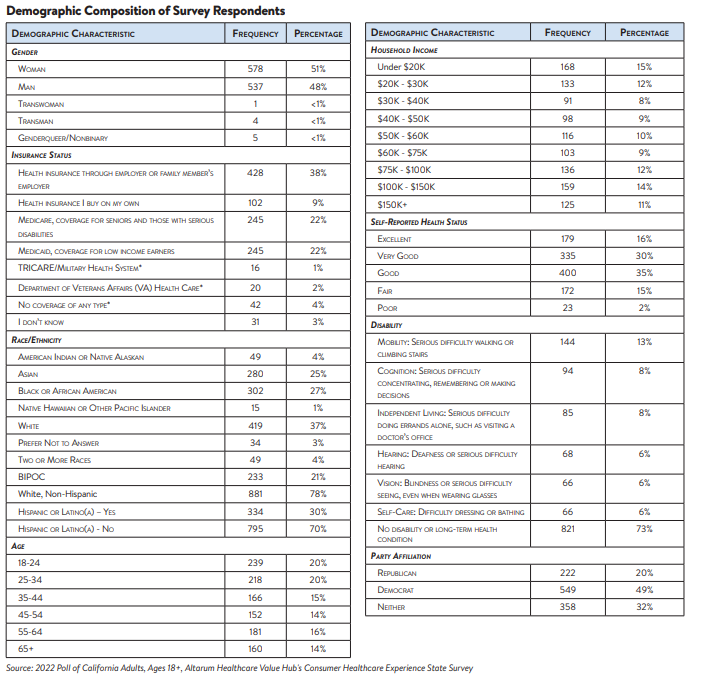
California respondents strongly endorse several hospital-related strategies, including:
- 89%–Require hospitals and doctors to provide up-front cost estimates to consumers3
- 89%–Strengthen policies to drive more competition in healthcare markets to improve choice and access.
- 88%–Set standard payments to hospitals for specific procedures
- 88%–Impose price controls on contracts between insurers and healthcare providers
What’s even more interesting is the level of support for these strategies across party lines (see Table 1).
Conclusion
The findings from this poll suggest that California respondents are motivated when it comes to searching for hospital cost and quality information to help inform purchasing decisions and plan for a future medical expense. However, California respondents searched for hospital cost information less than specialist or primary care provider costs, and they were less successful at finding hospital cost than other services, despite recent action at the federal level to make hospital prices more transparent.4,5
California respondents express widespread and strong support for government-led solutions to make price and quality information more readily accessible and to help consumers navigate hospital care. Many of the solutions that respondents’ support would take the burden of research and guesswork off consumers’ shoulders. Policymakers should investigate the evidence on these and other policy options to respond to California respondents’ bipartisan call for government action.
Notes
- As of January 1, 2021, the Centers for Medicare and Medicaid Services (CMS) requires hospitals to make public a machine-readable file containing a list of standard charges for all items and services provided by the hospital, as well as a consumer-friendly display of at least 300 shoppable services that a patient can schedule in advance. For more information, see: https://www.cms.gov/hospital-price-transparency/hospitals
- According to Health Forum, an affiliate of the American Hospital Association, hospital adjusted expenses per inpatient day in California were $4,181 in 2021, which is much higher than the national average and the highest in the country. See: Kaiser Family Foundation, State Health Facts Data: Hospital Adjusted Expenses per Inpatient Day. Accessed January 19, 2023. https://www.kff.org/health-costs/state-indicator/expenses-per-inpatient-day/?currentTimeframe=0&sortModel=%7B%22colId%22:%22Expenses%20per%20Inpatient%20Day%22,%22sort%22:%22desc%22%7D
- Ibid.
- This survey was conducted after the Centers for Medicare and Medicaid Services’ rule requiring hospitals to publicly display all standard charges for all items and services, as well as shoppable services, in a consumer-friendly format went into effect. However, the well-documented low compliance from large hospitals indicates that the rule has yet to demonstrate the desired effect. See: Kelly, Susan, “Hospitals Still Fall Short on Price Transparency, Consumer Group Says,” Healthcare Dive (Aug. 10, 2022). See also: Kurani, Nisha, et al., Early Results from Federal Price Transparency Rule Show Difficulty in Estimating the Cost of Care, Kaiser Family Foundation, (April 9, 2021).
- California Residents Experience Difficulty Estimating the Cost and Quality of Care; Express Bipartisan Support for Government Action, Healthcare Value Hub, Data Brief No.149 (January 2023)
Methodology
Altarum’s Consumer Healthcare Experience State Survey (CHESS) is designed to elicit respondents’ unbiased views on a wide range of health system issues, including confidence using the health system, financial burden and possible policy solutions. This survey, conducted from November 3 to November 15, 2022, used a web panel from online survey company Dynata with a demographically balanced sample of approximately 1,249 respondents who live in California. Information about Dynata’s recruitment and compensation methods can be found here. The survey was conducted in English or Spanish and restricted to adults ages 18 and older. Respondents who finished the survey in less than half the median time were excluded from the final sample, leaving 1,129 cases for analysis. After those exclusions, the demographic composition of respondents was as follows, although not all demographic information has complete response rates:
Percentages in the body of the brief are based on weighted values, while the data presented in the demographic table is unweighted. An explanation of weighted versus unweighted variables is available here. Altarum does not conduct statistical calculations on the significance of differences between groups in findings. Therefore, determinations that one group experienced a significantly different affordability burden than another should not be inferred. Rather, comparisons are for conversational purposes. The groups selected for this brief were selected by advocate partners in each state based on organizational/advocacy priorities. We do not report any estimates under N=100 and a co-efficient of variance more than 0.30.

HEALTHCARE VALUE HUB
The Healthcare Value Hub can help you find free, timely information about policies and practices to achieve health systems that are equitable, affordable, and focused on the goals and needs of the people the system is meant to serve.
Share
![]()
![]()
![]()

Follow
![]()
![]()


![]()